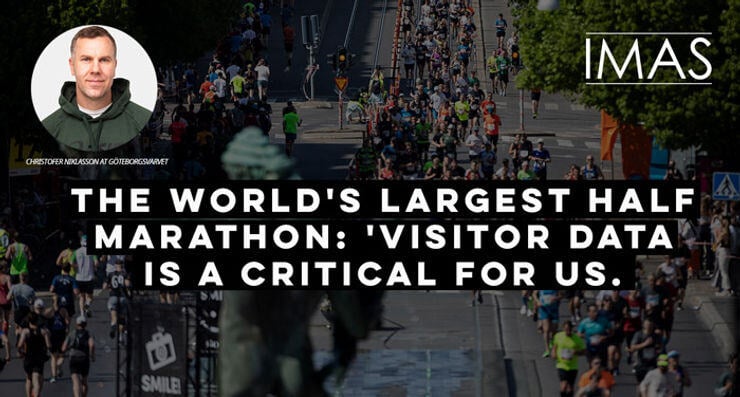
THE WORLD’S LARGEST HALF MARATHON: HOW VISITOR ANALYTICS SUPERCHARGE GÖTEBORGSVARVET
Using a customer counter system and retail footfall analytics, Göteborgsvarvet turns live crowd movement into staffing, safety, and commercial wins — for organizers and exhibitors alike.

WHY VISITOR ANALYTICS MATTER AT MASS-PARTICIPATION EVENTS
When 50,000+ runners and supporters converge on the city, guesswork breaks down. CountMatters combines people counting sensor technology, Wi-Fi analytics, and occupancy monitoring to show when and where flows concentrate — enabling right-time staffing, smarter queue design, and safer venue operations.
FROM GUESSES TO EVIDENCE: WHAT THE DATA REVEALS
Before analytics, exhibitors and volunteers often staffed “like last year.” With zone-based counts, Göteborgsvarvet can now see peak surges at bib distribution, corridor bottlenecks near entrance gates, and dwell-time patterns along high-value aisles — unlocking targeted fixes instead of blanket measures.
“Visitor flows to bib pickup guide our staffing plans for future years. The data gives us a reliable baseline.”
For exhibitors, footfall and dwell tie directly to lead capture and conversion. Knowing the busiest two hours helps coordinate staff breaks, demos, and promos without missing prime footfall.
HOW COUNTMATTERS POWERS ORGANIZERS AND EXHIBITORS
- Occupancy Monitoring Solution: Live counts per hall and gate to manage capacity and adjust flows.
- Zone Footfall & Dwell: Compare bib pickup vs. expo aisles to schedule staff where impact is highest.
- Queue Intelligence: Identify spikes, then resize lanes or move barriers to cut wait times.
- Exhibitor Value: Share aggregated visitor metrics that justify ROI and future participation.
- After-Action Review: Year-over-year benchmarking to prove improvements and secure stakeholders’ buy-in.
Want to see how combined data sources strengthen decisions? Read Unlocking insights with combined footfall data solutions.
GDPR & PRIVACY: HOW DATA IS HANDLED
CountMatters designs for privacy from the start. We use privacy-preserving sensors and aggregated analytics. No facial recognition. No PII in reporting. Data is processed for operational planning and safety, with strict retention policies and access controls appropriate for public events and venues.
IMPLEMENTATION CHECKLIST FOR EVENTS LIKE GÖTEBORGSVARVET
- Define Zones & Goals: Bib pickup, expo aisles, entrances, F&B, stage areas.
- Deploy Sensors: Install people counting sensors at gates, key corridors, and stands.
- Calibrate & Test: Validate accuracy before gates open; set alert thresholds for occupancy.
- Live Ops: Monitor dashboards; adjust staff rosters in 30–60 minute blocks when peaks hit.
- Post-Event Review: Compare zone performance, queue times, and staffing vs. outcome.
See how another large operator optimized staffing using visitor-sales data: Norway’s largest watch chain optimizes staff planning with visitor & sales data.
ROI: FROM CROWD CHAOS TO CONTROLLED THROUGHPUT
Customer counter system insights translate into fewer bottlenecks, better exhibitor outcomes, and tighter safety control. Organizers reduce queue abandonment, exhibitors align demos with real peaks, and sponsors enjoy steadier footfall to activations. The outcome is a smoother experience — and better commercial performance — without overspending on staff.
MINI-FAQ
How accurate are the people counting sensors?
Modern 3D sensors and calibrated Wi-Fi analytics deliver high accuracy in dynamic, multi-directional flows. We validate with on-site spot-checks before go-live.
What about pricing?
Solutions are scoped to venue size, zones, and reporting needs. We focus on measurable ROI through staffing efficiency and improved visitor experience.
Can exhibitors get their own numbers?
Yes — aggregated, zone-level metrics (e.g., aisle traffic and dwell patterns) that inform stand design, demo timing, and staff scheduling.
Do you store personal data?
No personal data is required for footfall analytics. Reporting is anonymized and aggregated, aligned with GDPR.
TRY IT AT YOUR NEXT EVENT
Ready to turn footfall into action? We’ll help you plan zones, deploy sensors, and deliver dashboards that your team actually uses.
VISUAL PLACEHOLDER
[Chart: Footfall by Zone vs. Staffing Levels — highlights under/over-staffed windows by 30-minute blocks.]
Tags:
public, Summer Adventures Await: A Visitor's Journey with, Unlocking the Full Potential of Your Shopping Cent, Combined solutions, cities, people counter, BLOG, wifi, See All, outdoor pool, All Posts, Conversation rate, Museum, parking system, traffic lights, personal planner, Fairs & Exhibitons, People Flow, Shopping center, capture rate, xovis3d, staff planner, Video, General, Parks & resorts, Get to know IMAS, Hjalmar Brage, IMAS Group, IMAS Group Teams Up with Deutsche Telekom for Next, Real-time Occupancy, retail, CareerJan 13, 2025 6:02:13 PM


Comments