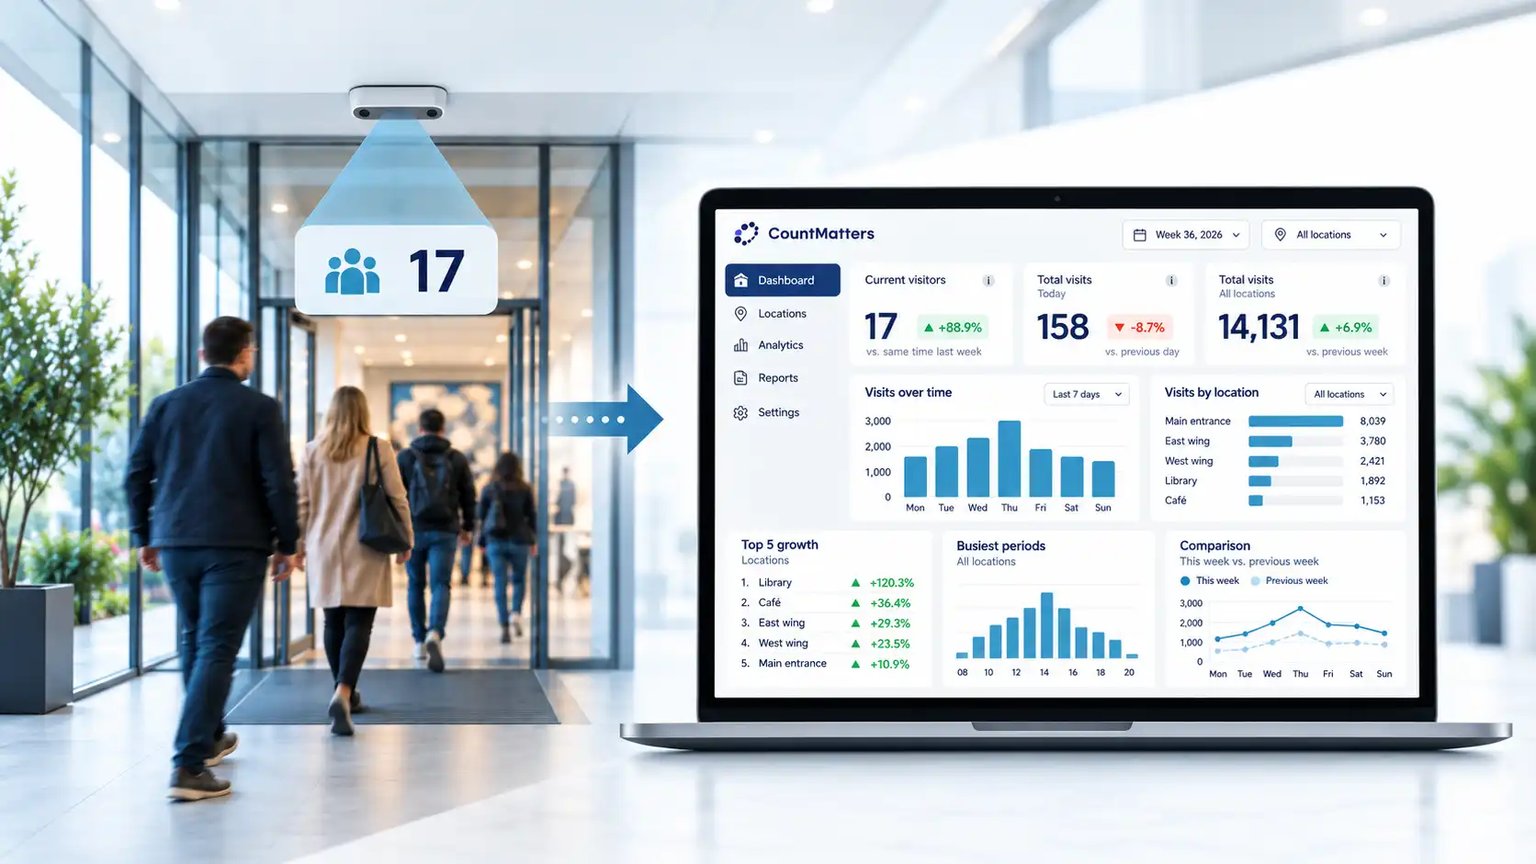

FRÅN BESÖKSTAL TILL BÄTTRE BESLUT

FOOTFALL
ANALYTICS

Se vad besökstalen faktiskt berättar.

People Counting ger er besökstalet. Footfall Analytics sätter siffrorna i sitt sammanhang över tid, platser och perioder – så att ni kan se trender, identifiera avvikelser och fatta bättre beslut om drift, bemanning, marknadsföring och kommersiell prestation.

Besökstrender Jämförelser Bättre beslut

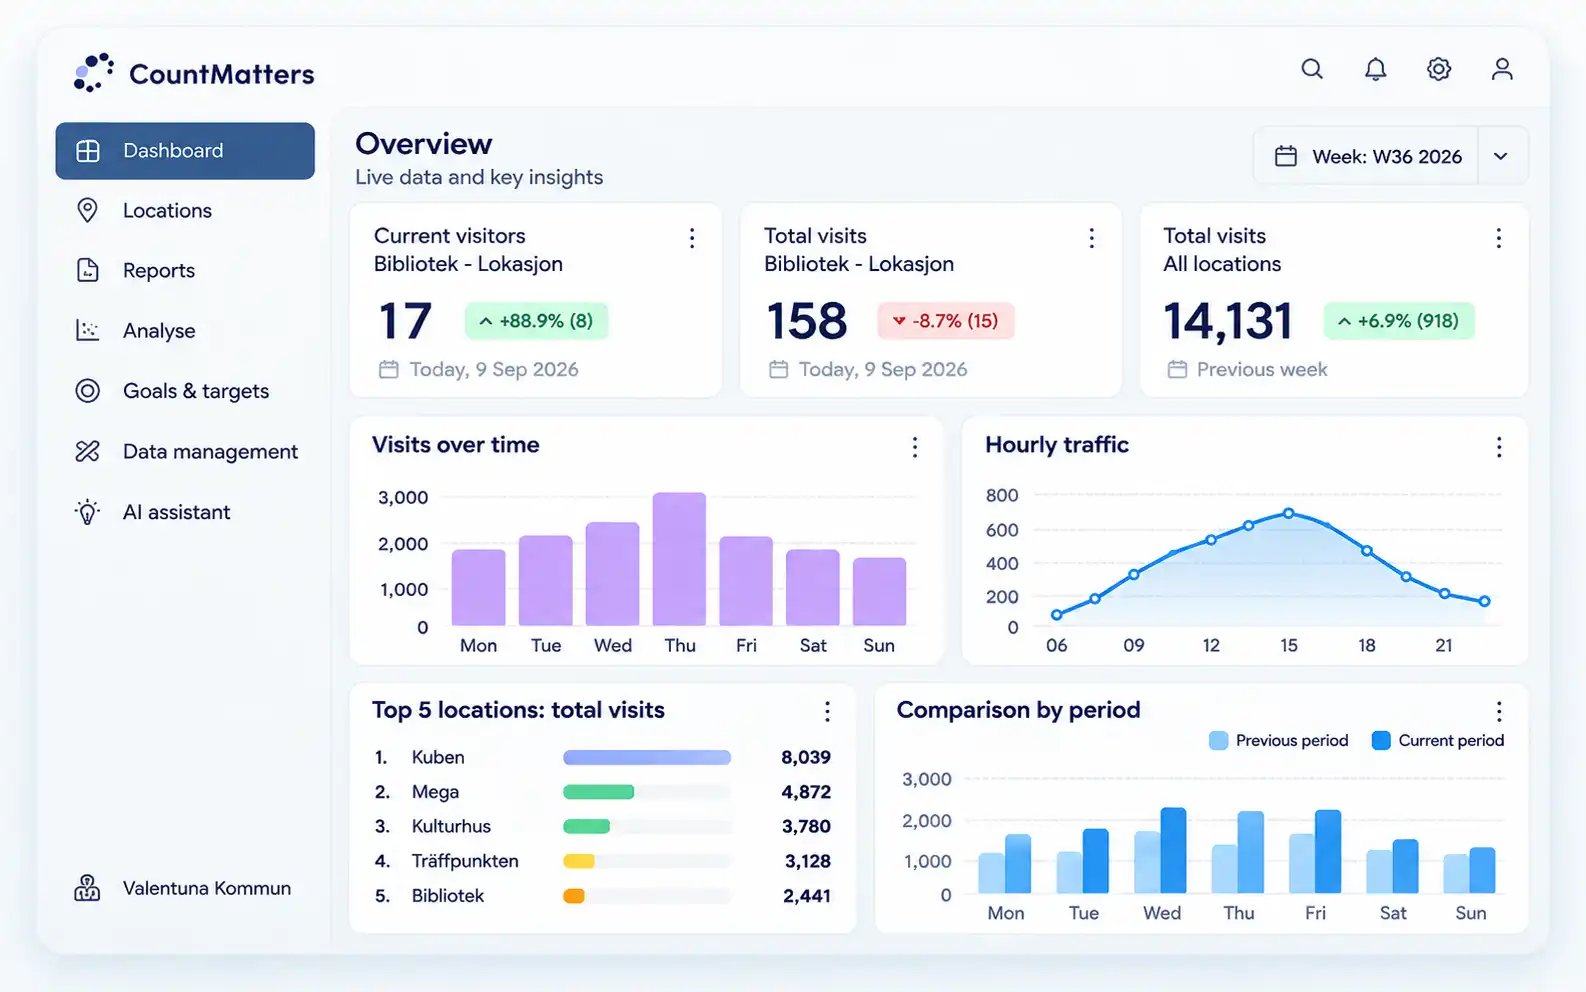
  Footfall Analytics visualiserat som utvecklingen av besökstal över tid och mellan platser
SE MÖNSTREN BAKOM BESÖKSTALEN
Från enskilda besökstal till jämförbara trender, mönster och beslutsunderlag.

FRÅN SIFFROR TILL INSIKT

Besökssiffran är bara början.

People Counting visar hur många människor som kommer. Footfall Analytics visar hur besökstrafiken utvecklas över timmar, dagar, perioder och platser. Det gör det enklare att förstå vad som är normalt, vad som har förändrats och var uppmärksamhet behövs.

PEOPLE COUNTING 12,482 besökare

Hur många människor kom?

FOOTFALL ANALYTICS
+8.4%
mot föregående period
  • När är trafiken som högst?
  • Vilka platser presterar bäst?
  • Ökar eller minskar besökstrafiken?
dashboard_image
RESULTAT En tydligare bild av hur besökstrafiken faktiskt utvecklas – och var det behövs åtgärder.

Siffrorna som visas är endast illustrativa.

SE MÖNSTREN

Förstå hur besökstrafiken förändras.

Följ utvecklingen över tid, identifiera toppperioder, jämför platser och upptäck förändringar innan de blir antaganden.

01

Trafikutveckling

Följ besökstrafiken per timme, dag, vecka, månad och år för att se om trafiken faktiskt ökar, minskar eller ligger stabilt.

Ökar eller minskar trafiken?
Totalt antal besök i
3,000 2,000 1,000 0
Mon Tue Wed Thu Fri Sat Sun
02

Toppperioder

Identifiera när besökstrycket faktiskt är som högst så att bemanning och resurser kan anpassas efter den verkliga trafiken.

När behöver vi mest kapacitet?
Trafik per timme i
800 600 400 200 0
00 03 06 09 12 15 18 21
03

Jämför platser

Jämför butiker, byggnader, entréer eller hela portföljer på samma grund och identifiera vilka platser som sticker ut.

Vilka platser presterar annorlunda?
Totalt antal besök per plats i
A
8,039
B
3,780
C
2,421
0 2,000 4,000 6,000 8,000 10,000
04

Jämför perioder

Jämför resultat med tidigare perioder för att skilja verkliga förändringar från normal variation.

Har resultatet faktiskt förbättrats?
Besök över tid
Nuvarande period Föregående period
3,000 2,000 1,000 0
Mon Tue Wed Thu Fri Sat Sun
Nuvarande +8.4%
Föregående 0.0%
GÖR DATA TILL HANDLING Tydligare insikter. Bättre beslut. Starkare platser.

Siffrorna som visas är endast illustrativa.

EN DATAGRUND. FLERA BESLUT.

Gör besöksdata användbara i hela organisationen.

Samma besöksdata svarar på olika frågor beroende på vem som använder dem. Footfall Analytics gör det enklare att använda trafikdata i verkliga operativa och kommersiella beslut.

01 · DRIFT

När uppstår besökstrycket faktiskt?

Använd tim- och dagsmönster för att anpassa bemanning, öppning och resurser efter verklig besöksefterfrågan.

TOPPTIDER VECKODAGAR SÄSONG
02 · MARKNAD

Ökade kampanjen faktiskt antalet besök?

Jämför trafiken före, under och efter kampanjer för att se om aktiviteten gav mätbara besök till den fysiska platsen.

FÖRE UNDER EFTER
dashboard_image
En datagrund för olika beslut.
03 · PLATSANSVARIG

Hur presterar min plats?

Följ utvecklingen över tid och upptäck ovanliga förändringar tidigt, innan beslut börjar bygga på antaganden.

TREND AVVIKELSE UTVECKLING
04 · PORTFÖLJANSVARIG

Vilka platser presterar annorlunda?

Jämför platser på samma datagrund för att identifiera hög- och lågpresterande platser och var djupare analys behövs.

BENCHMARK RANKING VARIANS
05 · LEDNING

Vad händer i hela verksamheten?

Gör tusentals individuella räkningar till en konsekvent bild av utveckling, säsongsmönster och skillnader mellan platser.

ÖVERSIKT KPIs UTVECKLING
JÄMFÖR MELLAN PLATSER

En plats visar vad som hände. En portfölj visar hur bra resultat ser ut.

När besöksdata mäts konsekvent mellan platser kan du jämföra resultat på samma grund – och se vilka platser som sticker ut.

  • Jämför trafikutveckling mellan platser
  • Identifiera platser som över- eller underpresterar
  • Jämför perioder med konsekventa KPI:er
  • Hitta avvikelser som behöver analyseras närmare
POÄNGEN

Benchmarking handlar inte om att skapa en ranking. Det handlar om att hitta skillnaderna som är värda att förstå.

PORTFÖLJÖVERSIKT

Besöksprestanda

SENASTE 30 DAGARNA
TOTAL TRAFIK 486,240 ↑ +6.8%
PLATSER 24 aktiva
PORTFÖLJUTVECKLING +4.2% mot föregående period
PLATS TRAFIK FÖRÄNDRING
01
Location A City Centre
+12.4%
02
Location B Regional
+7.1%
03
Location C High Street
+0.8%
04
Location D Suburban
−9.3%
AVVIKELSE UPPTÄCKT

Location D utvecklas betydligt svagare än portföljen.

Illustrativt exempel på portföljanalys.

TRAFIK ÄR BARA EN DEL AV RESULTATET

Är problemet trafiken – eller vad som händer efter att människor kommer?

Footfall Analytics visar om trafiken ökar eller minskar. Men trafik i sig förklarar inte hela den kommersiella prestationen.

Main retail environment
SCENARIO 01

Trafikproblem

Färre människor kommer till platsen. Utmaningen börjar före besöket.

TRAFIK −11.2%
SCENARIO 02

Konverteringsproblem

Trafiken är stabil men resultatet försämras. Problemet ligger i vad som händer efter att besöket börjar.

TRAFIK +0.6%
SCENARIO 03

Tillväxtmöjlighet

Trafiken ökar. Nästa fråga är om den ökade trafiken leder till bättre resultat.

TRAFIK +14.8%
NÄSTA NIVÅ AV INSIKT

När trafik inte räcker, gå vidare till Visitor Intelligence.

Koppla samman besöksdata med förbipasserande, capture rate, vistelsetid, demografi och försäljning för att förstå mer av den fysiska kundresan.

UTFORSKA VISITOR INTELLIGENCE
01
FÖRBIPASSERANDE Hur många passerar?
Passerby traffic
02
CAPTURE RATE Hur många går in?
Entering
03
VISTELSETID Hur länge stannar de?
Inside the location
04
DEMOGRAFI Vilka är de?
Visitor mix
05
FÖRSÄLJNING Vad är det kommersiella resultatet?
Commercial outcome

We are very satisfied with the staff planning tool, it has already helped us achieve efficient planning and increased revenue.

Helge Bjørklund

Founder and Partner, BJØRKLUND chain

CountMatters really wanted to understand our needs and I can only say that the daily support and delivery from CountMatters is unmatched. We as customers are taken very seriously and the support is proactive and immediate.

Niklas Holz

International Business Developer, Søstrene Grenes Import A/S

I am very satisfied with the Xperio portal. The dashboard provides a comprehensive view of how the stores are performing and I can immediately see which stores are doing best. In addition, I can easily compare and analyze data by day, week, month, or year.

Torstein Heldal

Center Manager, Oslo S and Østbanehallen

I think it works very well, CountMatters always provides quick service and responds quickly. The Xperio platform is also easy to use.

Hanna Svenaeus

Administrative Manager, Ragde Eiendom

No matter how big or small the task is, CountMatters always responds quickly and is eager to help. I am very satisfied with CountMatters and the services they offer so we can monitor and work with our visitor data on a daily basis.

Sigve Mydland

Center Manager, Herbarium Shopping Center

We have a good cooperation with CountMatters, which offers flexible solutions and personal service.

Göran Kirsch

Head of Security, Skansen, Stockholm

In my role as responsible for statistics, these visitor counters are an invaluable help and the CountMatters visitor counter is easy to use.

Malin Johansson

Librarian, TÄBY LIBRARY, Stockholm

We are satisfied. It has been running smoothly and consistently with CountMatters.

Thomas Hallin

Librarian, TÄBY LIBRARY

We are very satisfied with CountMatters support – Mr. Chaghouani and his team are very easy to work with and have largely adapted to our requirements. Criticism is received without hard feelings and they always try to find practical solutions to our problems.

Christine Glasow

Center Management, Seemaxx Outlet Center Radolfzell

Short communication paths and response times. CountMatters way of working is pragmatic and goal-oriented. They always support us in finding quick solutions to our tasks. I would especially like to highlight CountMatters innovative capabilities in this regard.

Björn Küster

Project Manager, ECE Projektmanagement G.m.b.H & Co. KG

CountMatters support team can solve problems quickly. Xperio Software is convenient and easy to use. Able to see real-time data on the number of people who enter Fashion Island. Feeling confident with the accuracy rate, +95% in the accuracy test every quarter. Overall, the counting solution from CountMatters is a very useful system for the Marketing Team to analyze the behavior of our customers.

Pornthep Butrsutthiwong (Duang)

Senior Supervisor – Building Management, Siam Retail Management Co., Ltd (Fashion Island Bangkok)

Fredrik Ståhl

Fredrik Ståhl

Sales Manager Sweden

+460701906588 fs@countmatters.com

Kontakta oss

Få klarhet i implementering, integration och nästa steg

Vi svarar vanligtvis inom en arbetsdag.

Transforming Visitor Data
into Business Success

For over 30 years, CountMatters has defined the standard in visitor analytics.
As the original innovators of people counting, we transform foot traffic into business intelligence.


700+
customers using our solutions
100k+
installations
 
30 Years+
Decades of actionable visitor insights.
 
Guaranteed Satisfaction
Your success is our goal


Transforming Visitor Data
into Business Success

For over 30 years, CountMatters has defined the standard in visitor analytics.
As the original innovators of people counting, we transform foot traffic into business intelligence.


700+
customers using our solutions
100k+
installations
 
30 Years+
Decades of actionable visitor insights.
 
Guaranteed Satisfaction
Your success is our goal


Transforming Visitor Data
into Business Success

For over 30 years, CountMatters has defined the standard in visitor analytics.
As the original innovators of people counting, we transform foot traffic into business intelligence.


700+
customers using our solutions
100k+
installations
 
30 Years+
Decades of actionable visitor insights.
 
Guaranteed Satisfaction
Your success is our goal


Transforming Visitor Data
into Business Success

For over 30 years, CountMatters has defined the standard in visitor analytics.
As the original innovators of people counting, we transform foot traffic into business intelligence.


700+
customers using our solutions
100k+
installations
 
30 Years+
Decades of actionable visitor insights.
 
Guaranteed Satisfaction
Your success is our goal


ELEVATE YOUR BUSINESS

We’ve been here from the beginning, we’re here today, and we’re here to stay.
Let’s turn your visitor data into smarter business decisions.

Transforming Visitor Data
into Business Success

For over 30 years, CountMatters has defined the standard in visitor analytics.
As the original innovators of people counting, we transform foot traffic into business intelligence.


700+
customers using our solutions
100k+
installations
 
30 Years+
Decades of actionable visitor insights.
 
Guaranteed Satisfaction
Your success is our goal


Transforming Visitor Data
into Business Success

For over 30 years, CountMatters has defined the standard in visitor analytics.
As the original innovators of people counting, we transform foot traffic into business intelligence.


700+
customers using our solutions
100k+
installations
 
30 Years+
Decades of actionable visitor insights.
 
Guaranteed Satisfaction
Your success is our goal