FROM FOOTFALL TO BETTER DECISIONS

FOOTFALL
ANALYTICS

See what your footfall data is really telling you.

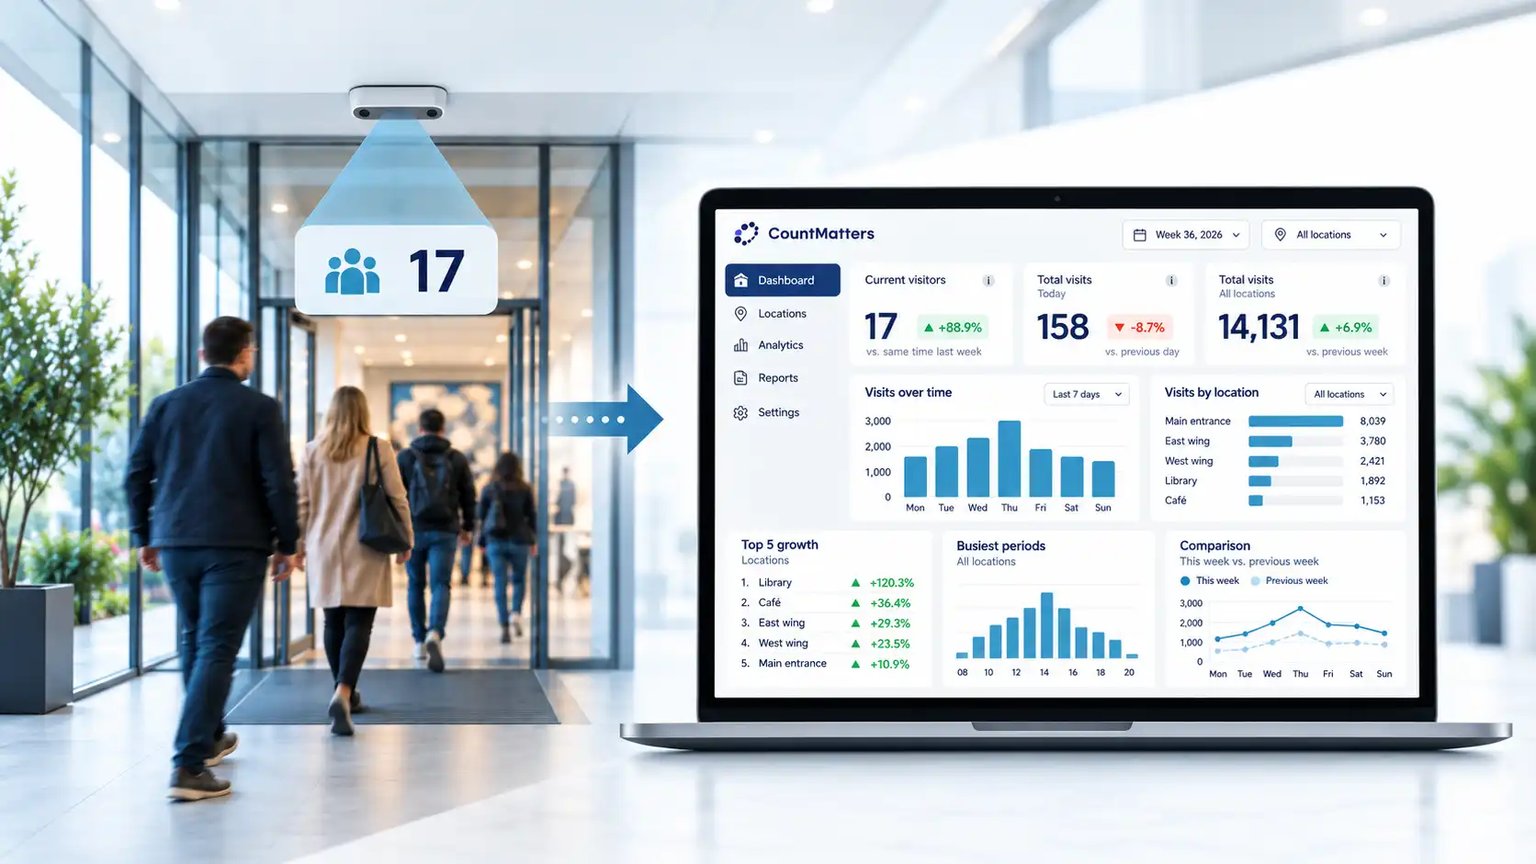
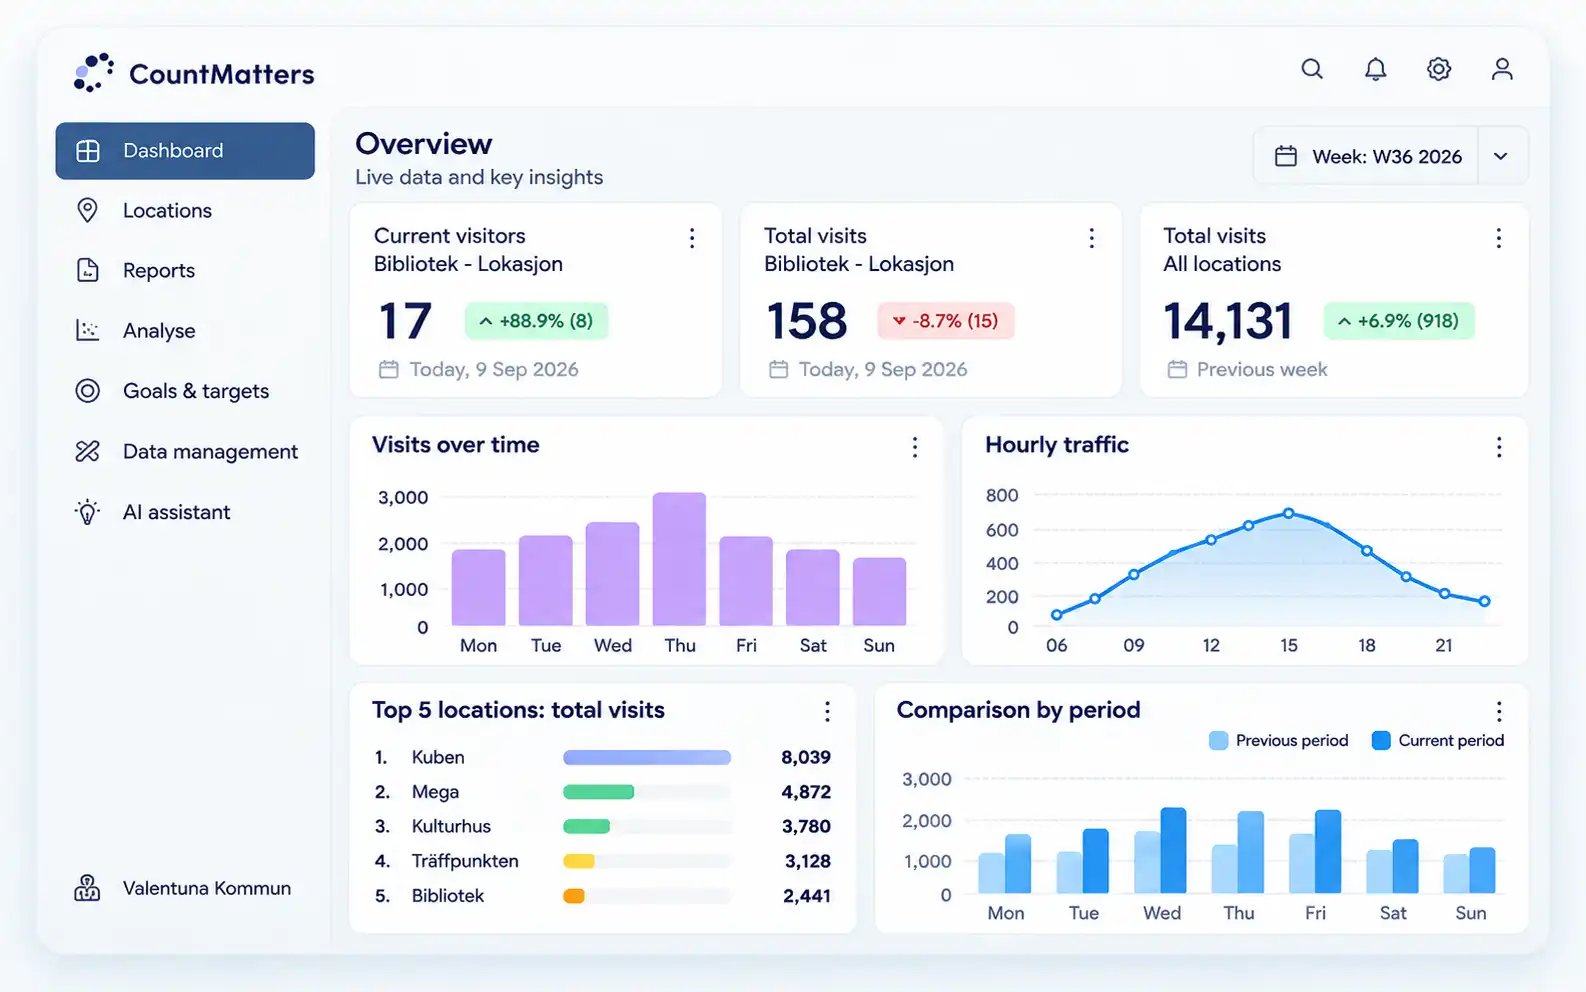
People Counting gives you the visitor number. Footfall Analytics puts that number into context across time, locations and periods – helping you identify trends, spot changes and make better decisions about operations, staffing, marketing and commercial performance.

Traffic trends Comparison Better decisions

  Footfall Analytics visualised as visitor trends across time and locations
SEE THE PATTERNS BEHIND THE FOOTFALL
From individual visitor counts to comparable trends, patterns and decision context.

FROM NUMBERS TO INSIGHT

The visitor count is only the beginning.

People Counting tells you how many people arrive. Footfall Analytics shows how visitor traffic develops across hours, days, periods and locations. That makes it easier to understand what is normal, what has changed and where attention is needed.

PEOPLE COUNTING 12,482 visitors

How many people came?

FOOTFALL ANALYTICS
+8.4%
vs. previous period
  • When is traffic highest?
  • Which locations are performing best?
  • Is footfall increasing or declining?
dashboard_image
OUTCOME A clearer view of how visitor traffic is actually developing — and where action is needed.

Figures shown are illustrative.

SEE THE PATTERNS

Understand how your footfall is changing.

Track development over time, identify peak periods, compare locations and spot changes before they become assumptions.

01

Traffic trends

Track visitor traffic by hour, day, week, month and year to see whether footfall is actually growing, declining or holding steady.

Is traffic increasing or declining?
Total visits i
3,000 2,000 1,000 0
Mon Tue Wed Thu Fri Sat Sun
02

Peak periods

Identify when visitor demand is actually highest so staffing and resources can be aligned with real traffic.

When do we need the most capacity?
Hourly traffic i
800 600 400 200 0
00 03 06 09 12 15 18 21
03

Compare locations

Compare stores, buildings, entrances or entire portfolios on the same basis and identify which locations stand out.

Which locations are performing differently?
Total visits by location i
A
8,039
B
3,780
C
2,421
0 2,000 4,000 6,000 8,000 10,000
04

Compare periods

Compare performance with previous periods to separate real changes from normal variation.

Has performance actually improved?
Visits over time
Current period Previous period
3,000 2,000 1,000 0
Mon Tue Wed Thu Fri Sat Sun
Current +8.4%
Previous 0.0%
TURN DATA INTO ACTION Clearer insights. Smarter decisions. Stronger places.

Figures shown are illustrative.

ONE DATA FOUNDATION. MULTIPLE DECISIONS.

Make footfall data useful across the organisation.

The same visitor data answers different questions depending on who uses it. Footfall Analytics makes it easier to apply traffic data to real operational and commercial decisions.

01 · OPERATIONS

When does visitor demand actually occur?

Use hourly and daily patterns to align staffing, opening routines and resources with real visitor demand.

PEAK TIMES WEEKDAYS SEASON
02 · MARKETING

Did the campaign actually increase visits?

Compare traffic before, during and after campaigns to see whether activity translated into measurable visits at the physical location.

BEFORE DURING AFTER
dashboard_image
One data foundation for different decisions.
03 · LOCATION MANAGEMENT

How is my location performing?

Track development over time and identify unusual changes early, before decisions start relying on assumptions.

TREND ANOMALY DEVELOPMENT
04 · PORTFOLIO MANAGEMENT

Which locations are performing differently?

Compare locations on the same data foundation to identify high and low performers and where deeper investigation is warranted.

BENCHMARK RANKING VARIANCE
05 · LEADERSHIP

What is happening across the business?

Turn thousands of individual counts into a consistent view of development, seasonal patterns and differences across locations.

OVERVIEW KPIs DEVELOPMENT
COMPARE ACROSS LOCATIONS

One location shows what happened. A portfolio shows what good performance looks like.

When footfall is measured consistently across locations, you can compare performance on the same basis — and see which locations stand out.

  • Compare traffic development across locations
  • Identify locations that over- or underperform
  • Benchmark periods using consistent KPIs
  • Find outliers that deserve deeper analysis
THE POINT

Benchmarking is not about creating a leaderboard. It is about finding the differences worth understanding.

PORTFOLIO OVERVIEW

Footfall performance

LAST 30 DAYS
TOTAL TRAFFIC 486,240 ↑ +6.8%
LOCATIONS 24 active
PORTFOLIO TREND +4.2% vs. previous
LOCATION TRAFFIC CHANGE
01
Location A City Centre
+12.4%
02
Location B Regional
+7.1%
03
Location C High Street
+0.8%
04
Location D Suburban
−9.3%
VARIANCE DETECTED

Location D is developing significantly below the portfolio.

Illustrative example of portfolio analysis.

TRAFFIC IS ONLY PART OF THE PERFORMANCE

Is the problem traffic — or what happens after people arrive?

Footfall Analytics shows whether traffic is growing or declining. But traffic alone does not explain the full commercial performance.

Main retail environment
SCENARIO 01

Traffic problem

Fewer people are arriving at the location. The issue starts before the visit.

TRAFFIC −11.2%
SCENARIO 02

Conversion problem

Traffic is stable, but performance is weakening. The issue lies in what happens after the visit begins.

TRAFFIC +0.6%
SCENARIO 03

Growth opportunity

Traffic is increasing. The next question is whether that additional traffic is turning into better results.

TRAFFIC +14.8%
THE NEXT LAYER OF INSIGHT

When traffic is not enough, move into Visitor Intelligence.

Connect footfall with passerby traffic, capture rate, dwell time, demographics and sales to understand more of the physical customer journey.

EXPLORE VISITOR INTELLIGENCE
01
PASSERBY How many pass the location?
Passerby traffic
02
CAPTURE RATE How many go inside?
Entering
03
DWELL TIME How long do they stay?
Inside the location
04
DEMOGRAPHICS Who are they?
Visitor mix
05
SALES What is the commercial result?
Commercial outcome

We are very satisfied with the staff planning tool, it has already helped us achieve efficient planning and increased revenue.

Helge Bjørklund

Founder and Partner, BJØRKLUND chain

CountMatters really wanted to understand our needs and I can only say that the daily support and delivery from CountMatters is unmatched. We as customers are taken very seriously and the support is proactive and immediate.

Niklas Holz

International Business Developer, Søstrene Grenes Import A/S

I am very satisfied with the Xperio portal. The dashboard provides a comprehensive view of how the stores are performing and I can immediately see which stores are doing best. In addition, I can easily compare and analyze data by day, week, month, or year.

Torstein Heldal

Center Manager, Oslo S and Østbanehallen

I think it works very well, CountMatters always provides quick service and responds quickly. The Xperio platform is also easy to use.

Hanna Svenaeus

Administrative Manager, Ragde Eiendom

No matter how big or small the task is, CountMatters always responds quickly and is eager to help. I am very satisfied with CountMatters and the services they offer so we can monitor and work with our visitor data on a daily basis.

Sigve Mydland

Center Manager, Herbarium Shopping Center

We have a good cooperation with CountMatters, which offers flexible solutions and personal service.

Göran Kirsch

Head of Security, Skansen, Stockholm

In my role as responsible for statistics, these visitor counters are an invaluable help and the CountMatters visitor counter is easy to use.

Malin Johansson

Librarian, TÄBY LIBRARY, Stockholm

We are satisfied. It has been running smoothly and consistently with CountMatters.

Thomas Hallin

Librarian, TÄBY LIBRARY

We are very satisfied with CountMatters support – Mr. Chaghouani and his team are very easy to work with and have largely adapted to our requirements. Criticism is received without hard feelings and they always try to find practical solutions to our problems.

Christine Glasow

Center Management, Seemaxx Outlet Center Radolfzell

Short communication paths and response times. CountMatters way of working is pragmatic and goal-oriented. They always support us in finding quick solutions to our tasks. I would especially like to highlight CountMatters innovative capabilities in this regard.

Björn Küster

Project Manager, ECE Projektmanagement G.m.b.H & Co. KG

CountMatters support team can solve problems quickly. Xperio Software is convenient and easy to use. Able to see real-time data on the number of people who enter Fashion Island. Feeling confident with the accuracy rate, +95% in the accuracy test every quarter. Overall, the counting solution from CountMatters is a very useful system for the Marketing Team to analyze the behavior of our customers.

Pornthep Butrsutthiwong (Duang)

Senior Supervisor – Building Management, Siam Retail Management Co., Ltd (Fashion Island Bangkok)

David Kern Sloth

David Kern Sloth

Chief Revenue Officer

+4531542114 dks@countmatters.com
Fredrik Ståhl

Fredrik Ståhl

Sales Manager Sweden

+460701906588 fs@countmatters.com
Anders Hamstad

Anders Hamstad

Sales Manager Norway

+4795007434 ah@countmatters.com
Naoufal Chaghouani

Naoufal Chaghouani

Sales Manager Germany

+4915114104852 nc@countmatters.com

Get in touch

Get clarity on setup, integration, and next steps

We typically respond within one business day.

Transforming Visitor Data
into Business Success

For over 30 years, CountMatters has defined the standard in visitor analytics.
As the original innovators of people counting, we transform foot traffic into business intelligence.


700+
customers using our solutions
100k+
installations
 
30 Years+
Decades of actionable visitor insights.
 
Guaranteed Satisfaction
Your success is our goal


Transforming Visitor Data
into Business Success

For over 30 years, CountMatters has defined the standard in visitor analytics.
As the original innovators of people counting, we transform foot traffic into business intelligence.


700+
customers using our solutions
100k+
installations
 
30 Years+
Decades of actionable visitor insights.
 
Guaranteed Satisfaction
Your success is our goal


Transforming Visitor Data
into Business Success

For over 30 years, CountMatters has defined the standard in visitor analytics.
As the original innovators of people counting, we transform foot traffic into business intelligence.


700+
customers using our solutions
100k+
installations
 
30 Years+
Decades of actionable visitor insights.
 
Guaranteed Satisfaction
Your success is our goal


Transforming Visitor Data
into Business Success

For over 30 years, CountMatters has defined the standard in visitor analytics.
As the original innovators of people counting, we transform foot traffic into business intelligence.


700+
customers using our solutions
100k+
installations
 
30 Years+
Decades of actionable visitor insights.
 
Guaranteed Satisfaction
Your success is our goal


ELEVATE YOUR BUSINESS

We’ve been here from the beginning, we’re here today, and we’re here to stay.
Let’s turn your visitor data into smarter business decisions.

Transforming Visitor Data
into Business Success

For over 30 years, CountMatters has defined the standard in visitor analytics.
As the original innovators of people counting, we transform foot traffic into business intelligence.


700+
customers using our solutions
100k+
installations
 
30 Years+
Decades of actionable visitor insights.
 
Guaranteed Satisfaction
Your success is our goal


Transforming Visitor Data
into Business Success

For over 30 years, CountMatters has defined the standard in visitor analytics.
As the original innovators of people counting, we transform foot traffic into business intelligence.


700+
customers using our solutions
100k+
installations
 
30 Years+
Decades of actionable visitor insights.
 
Guaranteed Satisfaction
Your success is our goal