


VISITS
+4.8%
01
Is centre traffic growing?
Compare days, weeks and seasons to understand how total visitor traffic develops over time.
Measure visitor traffic across entrances, understand how footfall changes over time and build a clearer picture of the patterns behind centre performance.

Visitor data becomes more useful when it helps you understand trends, differences and what changed.
Compare days, weeks and seasons to understand how total visitor traffic develops over time.

Compare measured entrances and see where visitor volumes are highest and where they are changing.

Compare traffic before, during and after an activation to see whether the visitor pattern actually changed.

Identify peak hours, days and recurring patterns that can support planning and operations.
Visitor data is the starting point. The value lies in the questions it helps you answer.
CountMatters builds insight layer by layer — from reliable counting to traffic analysis and a deeper understanding of how the centre is used.

Count visitors across measured entrances and locations to establish a reliable traffic baseline.
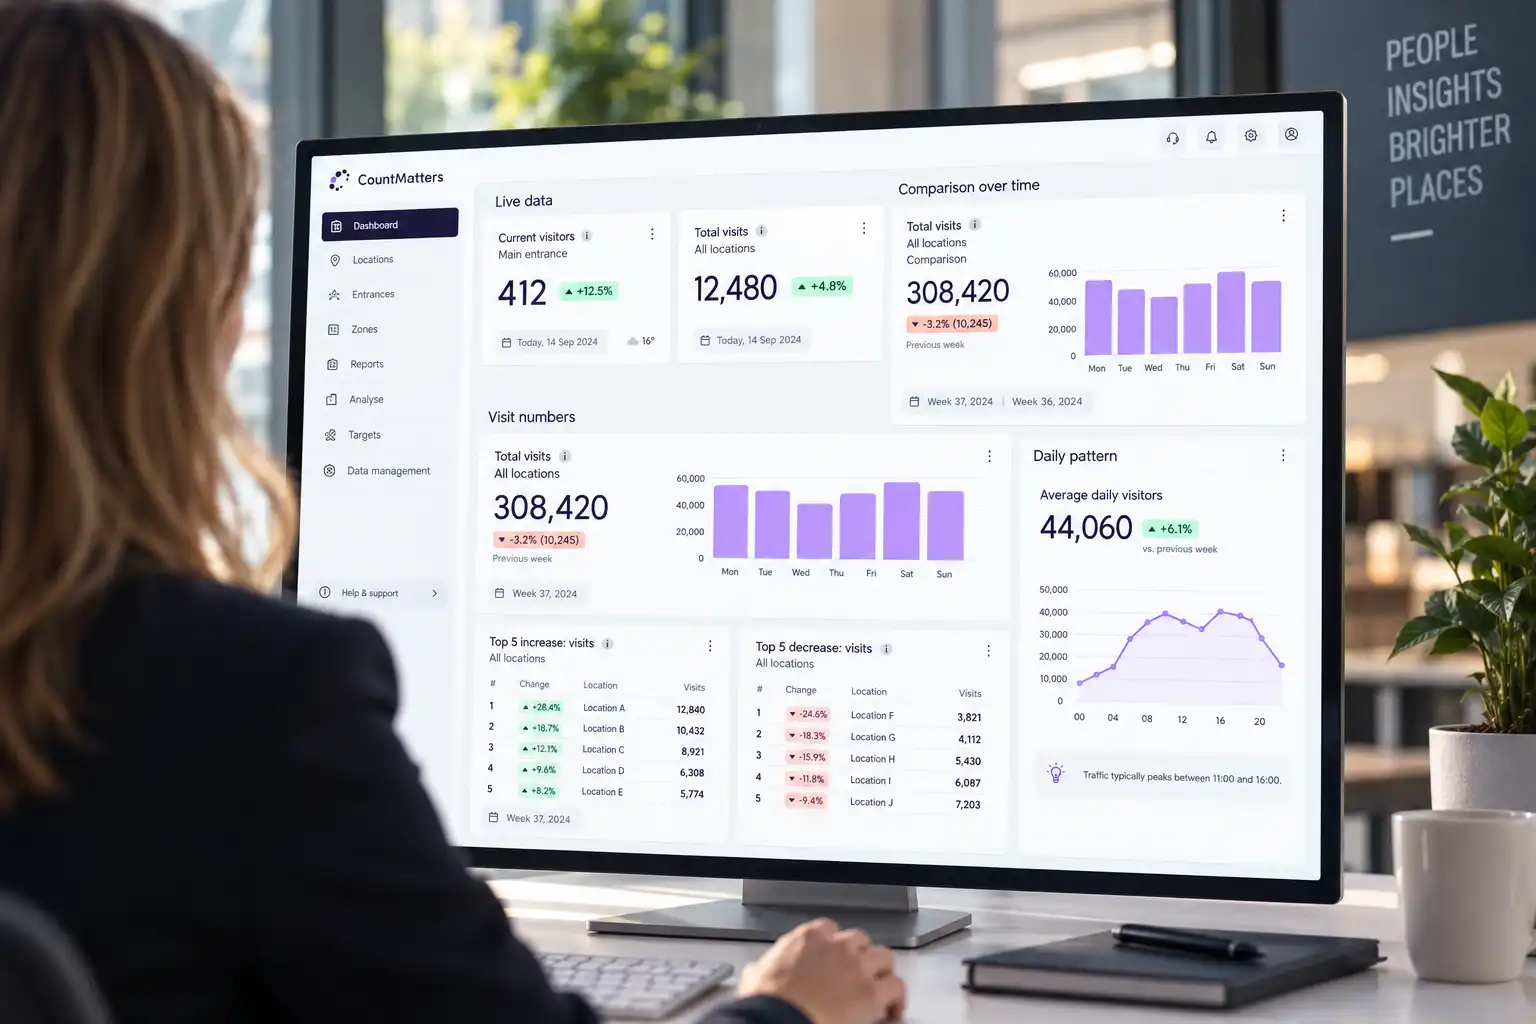
Compare periods, entrances and locations to identify trends, peaks and differences.

Where supported, add deeper insight into zones, dwell, movement patterns and relevant business data.
The same data foundation. Deeper understanding as your needs grow.
Visitor traffic can support decisions across the organisation. The question changes depending on who is looking at the data.

Use visitor patterns to understand busy periods, compare entrances and support operational planning.

Compare footfall before, during and after campaigns, events and seasonal activity to understand whether visitor patterns changed.

Use consistent traffic data to understand how measured parts of the centre are developing and add visitor context to discussions about the asset.

For multi-centre organisations, consistent measurement can help compare traffic development and identify where changes deserve attention.
The same visitor traffic. Different questions. A more consistent basis for decisions.