

Visitor analytics for public buildings
Measure visitor traffic at entrances and relevant locations. See when activity is highest, how usage patterns change and how different buildings develop over time.
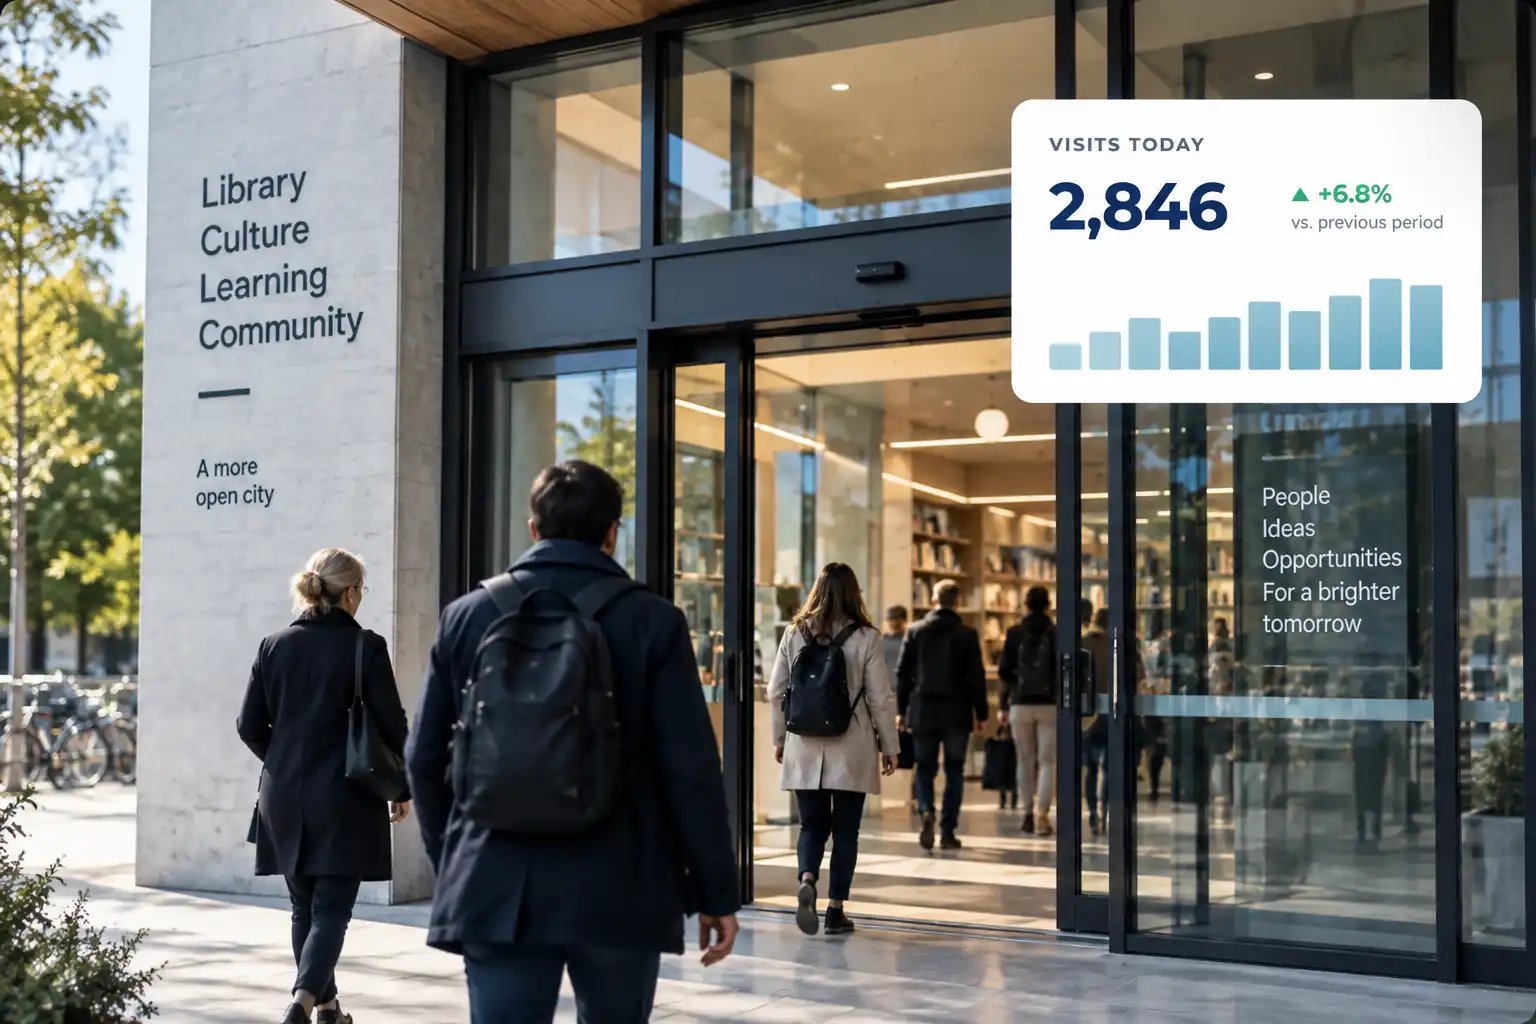
Know how many people visit measured buildings and entrances.
See when activity is highest and how it changes.
Compare usage patterns across buildings and over time.
FROM VISITOR TOTALS TO USAGE PATTERNS
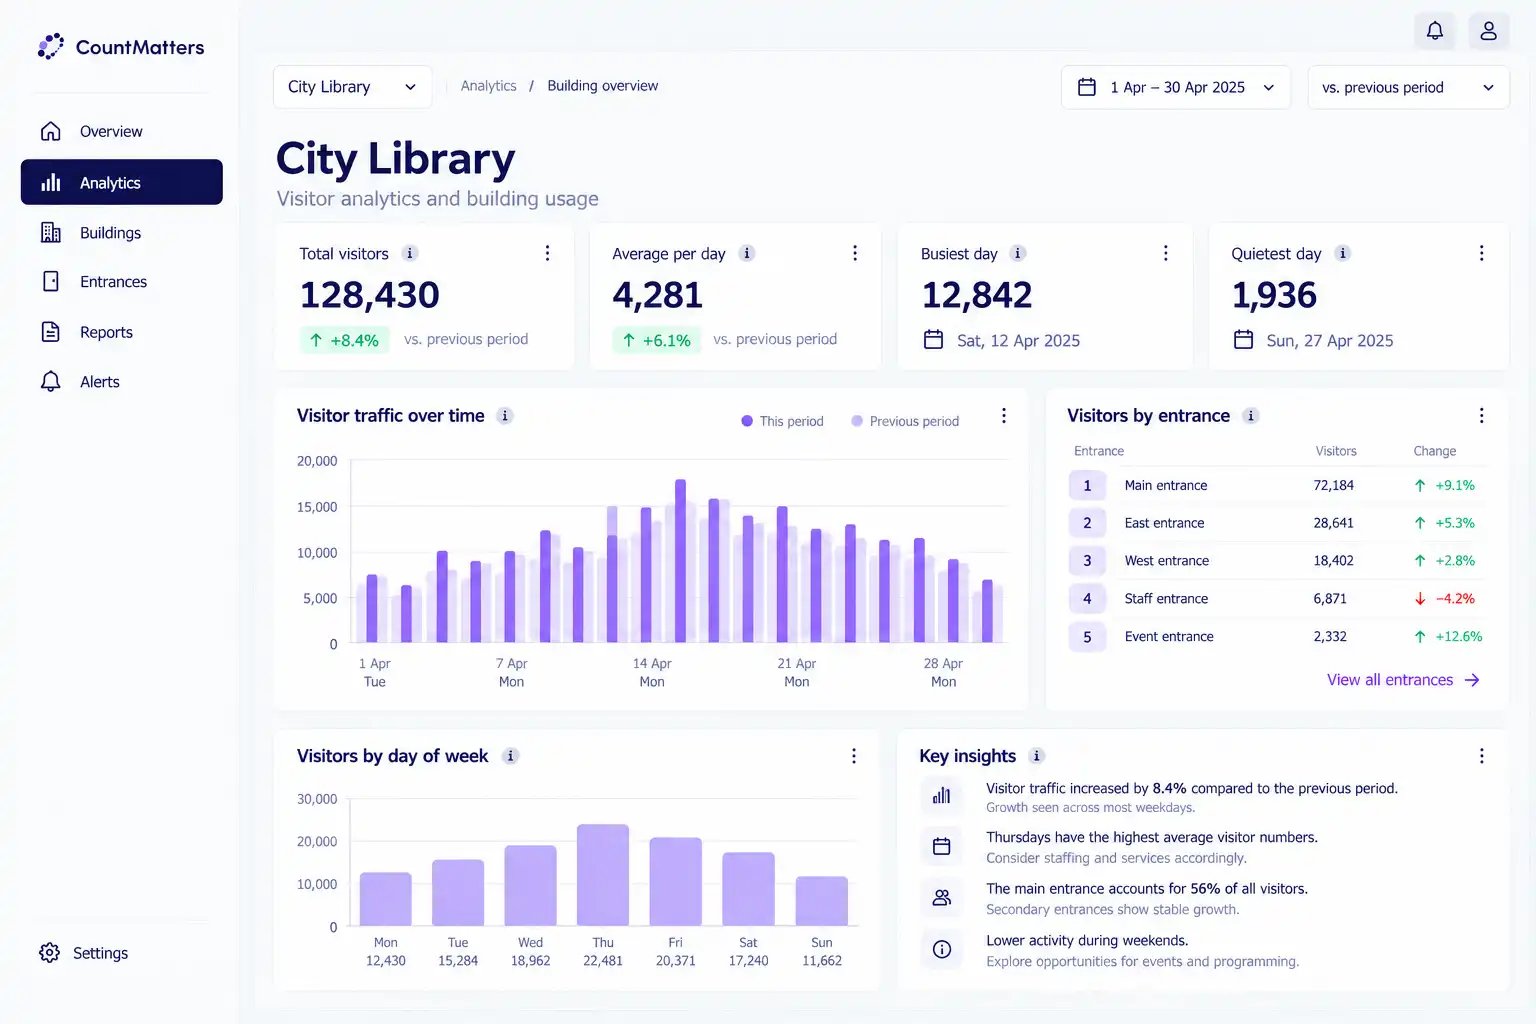
Two days can have almost the same number of visits and still show very different traffic patterns. See when visits occur, which entrances are used and how activity is distributed throughout the day.
The total is the starting point. The usage pattern shows how activity is distributed.
The total alone does not show when activity is highest.
FROM VISITOR DATA TO BETTER QUESTIONS
Visitor totals are the starting point. When you track activity throughout the day, across entrances and over time, it becomes easier to see patterns and changes worth investigating further.
See how visitor traffic is distributed across the day, week and year, and when activity is highest.
Compare measured entrances and other relevant measurement points to see how visitor traffic is distributed.
Compare days, weeks, seasons and years to see how activity patterns change over time.
Compare activity before, during and after changes such as opening hours, services or changes to the physical building.
The data shows what changed. Other context may be needed to understand why.
FROM COUNTING TO UNDERSTANDING
CountMatters builds on one common data foundation — from reliable visitor measurement to analysis of change and more context on how buildings are used.
Measure visits across relevant entrances and buildings to establish a consistent data foundation for volume, time and place.
Compare periods, entrances and buildings to see peaks, trends and differences in how visitor traffic develops.
Where supported, zones, dwell time, movement patterns and other relevant data can provide a deeper picture of how buildings and areas are used.
Start with what you need today. Build further on the same data foundation.
FROM VISITOR DATA TO DECISION SUPPORT
A consistent view of visits and usage gives different teams a shared data foundation — from day-to-day operations to long-term planning of buildings and services.
See how visitor traffic is distributed throughout the day and when activity is highest. Use these patterns as a data foundation for day-to-day operational planning.
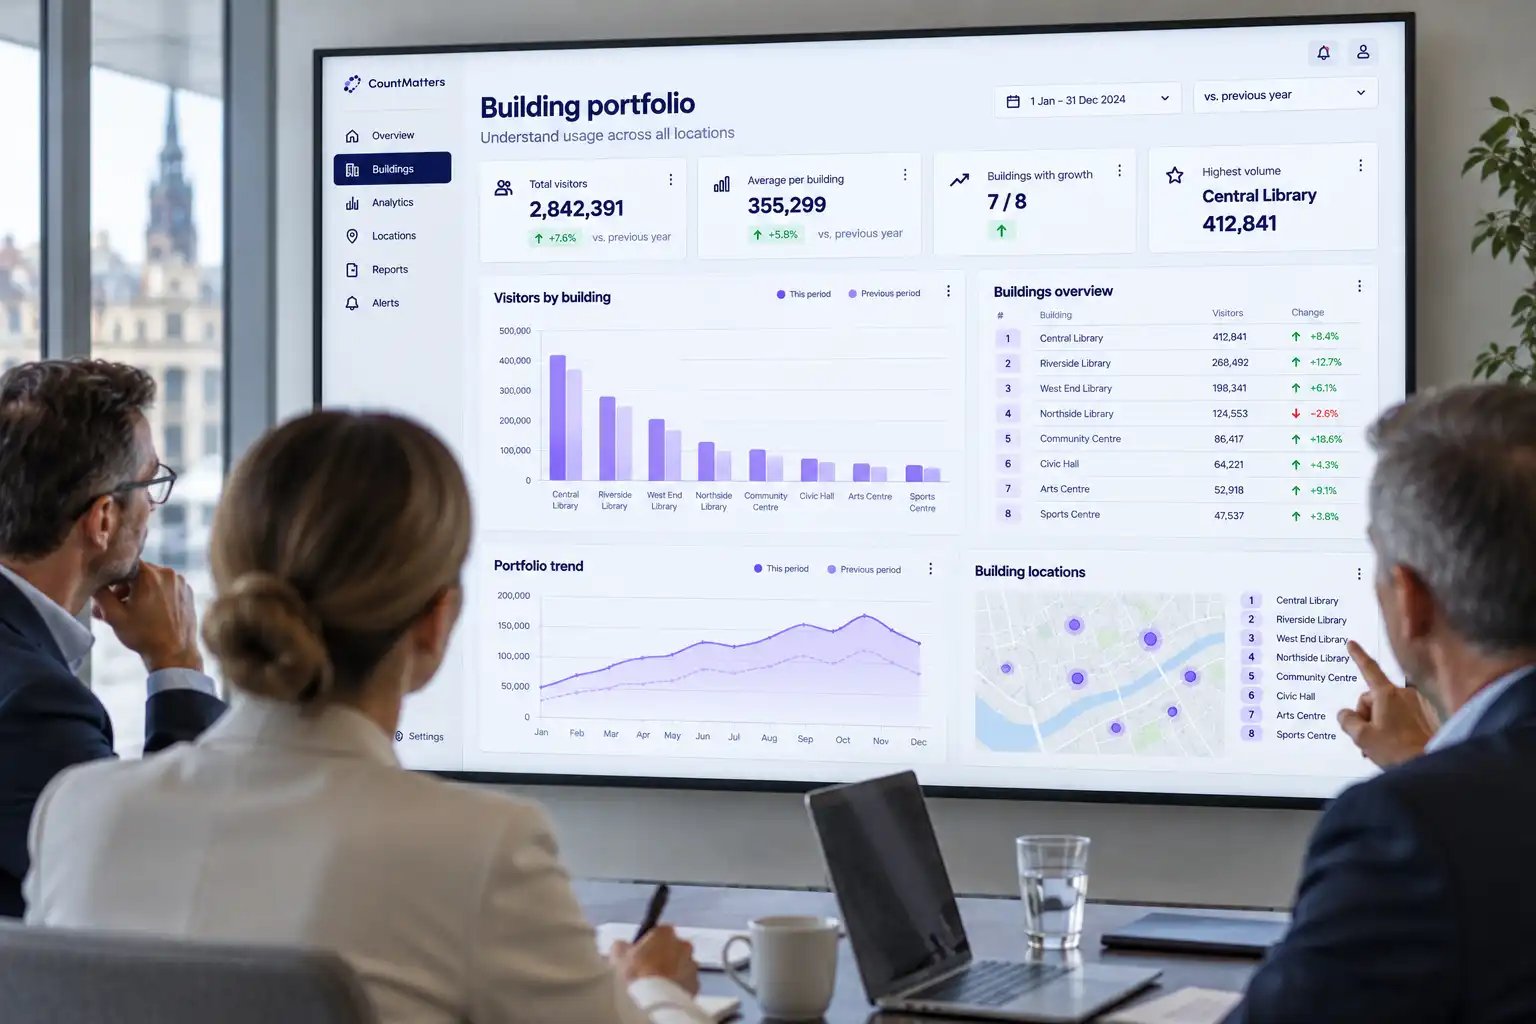
Compare measured buildings on the same data foundation to see differences in visitor volume, patterns and development over time.
Track visits and usage patterns across weeks, months and years to build a long-term data foundation for planning and follow-up.
Compare activity before, during and after changes such as opening hours, services or changes to the physical building to see how the usage pattern developed.
The count is the starting point. The value lies in a consistent data foundation for understanding how usage changes.
A DATA FOUNDATION BUILT FOR THE LONG TERM
CountMatters has worked with counting technology and visitor data for more than 30 years. For public buildings, that means a long-term data foundation with consistent measurement that supports comparison across buildings, periods and development over time.
Use the same measurement foundation across relevant entrances, buildings and periods.
Compare visits and usage patterns across time and buildings on a consistent basis.
Build a history that makes it possible to track how visits and usage develop across months and years.
FROM ENTRANCE TO BUILDING PORTFOLIO
Start with visits at a relevant entrance. Build a wider view of the building — then compare development across multiple buildings on the same data foundation.
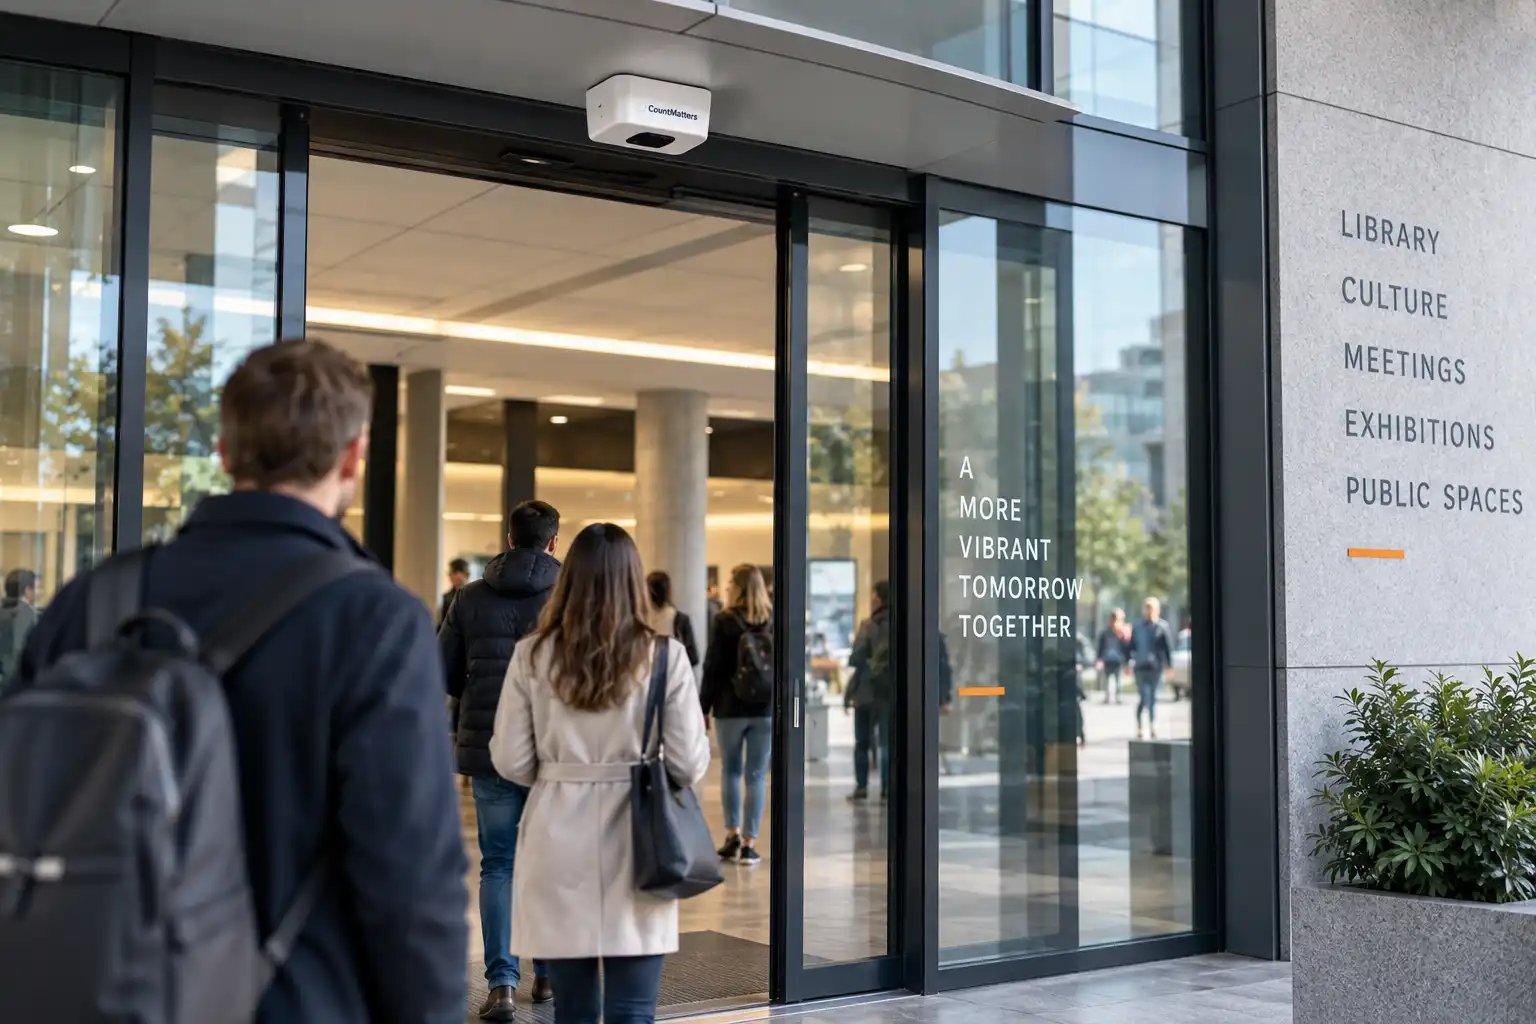
Measure visits at relevant entrances and establish a consistent starting point for the building.
See how visits and usage patterns develop throughout the day and over time across relevant measurement points.
Compare buildings on the same data foundation to see where visitor patterns and development differ — and where closer investigation may be useful.
From one entrance to multiple buildings. The same consistent data foundation.
Tell us which buildings you want to measure and what questions you are trying to answer. We’ll show you how CountMatters can provide a consistent data foundation for visits, usage patterns and development over time.
Establish consistent measurement across relevant entrances and buildings.
See when activity is highest and how patterns change throughout the day and over time.
Track development on the same data foundation and see where visits and usage patterns differ.
Leave your company and email, and we’ll get in touch to clarify which buildings, entrances and questions are relevant to you.
A short conversation. No obligation.