
When is activity highest?
See how measured activity is distributed across hours, days and longer periods, and identify when different places are most active.
VISITOR ANALYTICS FOR CITIES
Measure activity across streets, squares and other public spaces. See when and where activity changes, compare measured places and build a consistent picture of development over time.
SEE MORE THAN THE TOTAL
Activity across a city is not evenly distributed. Streets, squares and other public spaces can show very different patterns throughout the day, week and year.
When activity is measured consistently across places and over time, the differences behind the total become visible. You can see where patterns vary and which developments deserve closer investigation.
The total is the starting point. The value lies in seeing where, when and how activity changes.
FROM ACTIVITY TO UNDERSTANDING
When activity is measured consistently across places and over time, you can see when peaks occur, where patterns vary and which changes deserve closer investigation.
See how measured activity is distributed across hours, days and longer periods, and identify when different places are most active.
Compare measured streets, squares and other public spaces on the same data foundation to see where activity patterns are developing differently.
Track development across days, weeks, seasons and years to distinguish short-term variation from more persistent changes in activity.
Compare activity before, during and after changes to public space, access, events or other relevant conditions to see how the pattern developed.
The count is the starting point. The value lies in seeing when, where and how activity changes.
FROM POINT TO CITY
One measurement point shows activity in one place. When multiple places are measured consistently, you can compare patterns, see how areas develop and build a consistent picture of activity across the city.
Measure activity on relevant streets, passages or other points. Track volume, peaks and development at the same place over time.
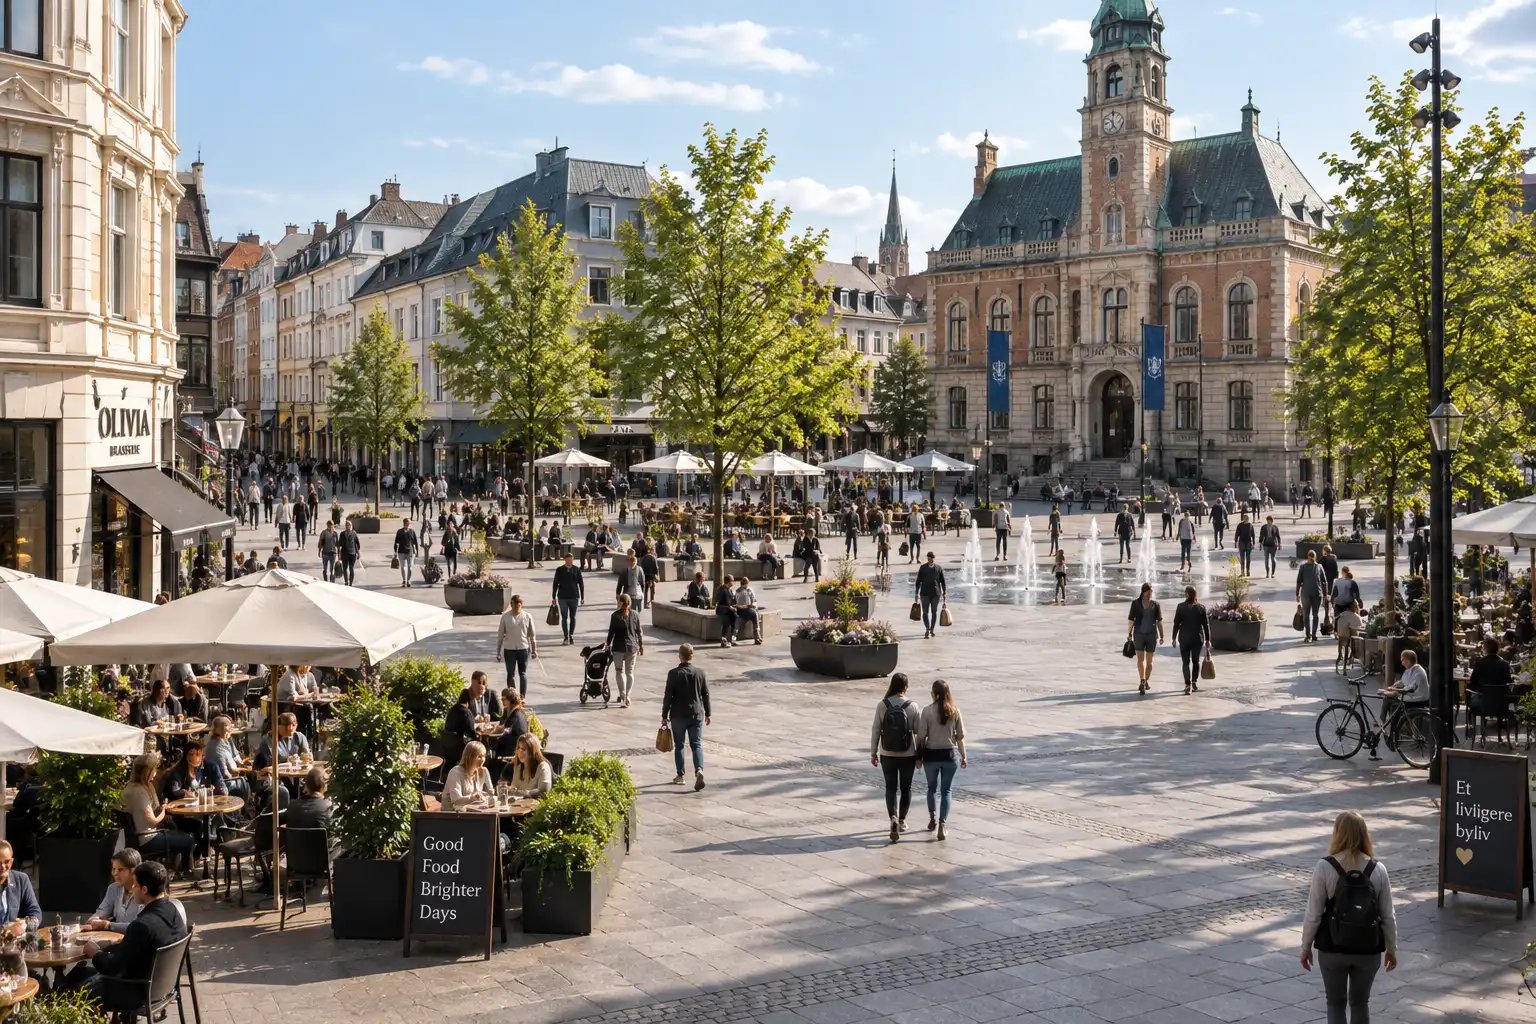
Compare relevant measurement points across a public space, shopping street or area to see where activity patterns vary.
Use consistent measurement across multiple places to compare development, see where patterns vary and identify which changes deserve closer investigation.
The goal is not to rank places. It is to see how activity develops differently — and where closer investigation is worthwhile.
THE SAME DATA. DIFFERENT QUESTIONS.
Consistent activity data can support different parts of a municipality or organisation. The data foundation stays the same — the questions and decisions differ.
OPERATIONS & PUBLIC SPACE
FOR THE DAY-TO-DAY PICTURE
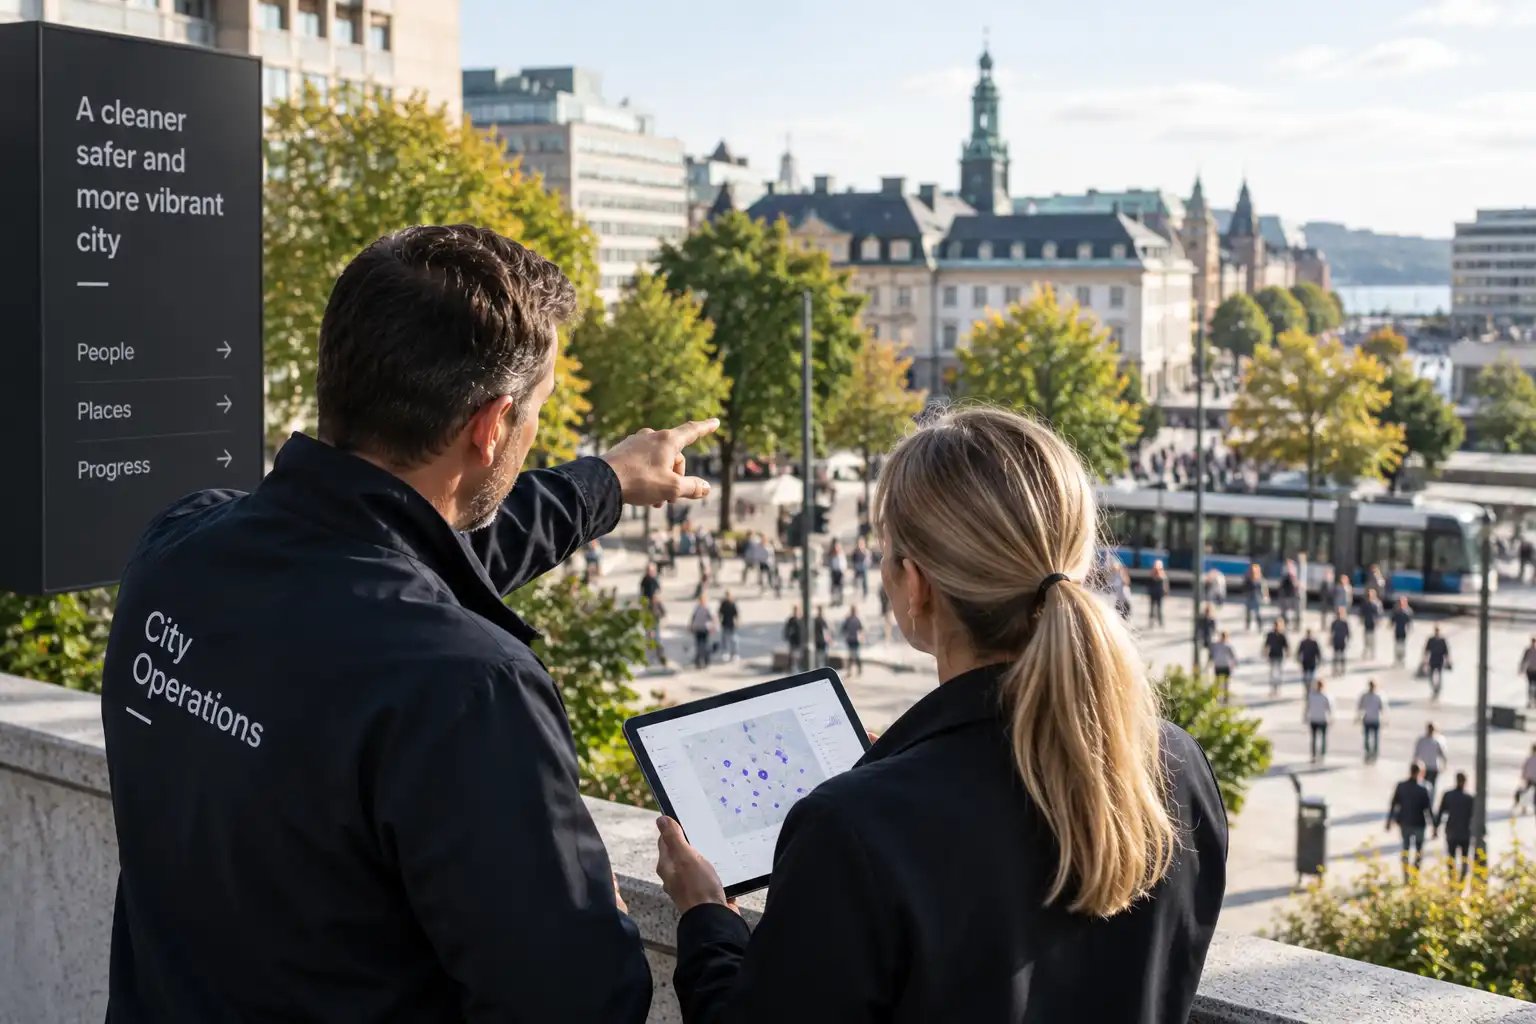
Track activity across relevant places, see when peaks occur and how patterns change throughout the day and over time.
URBAN PLANNING
FOR LONG-TERM DEVELOPMENT
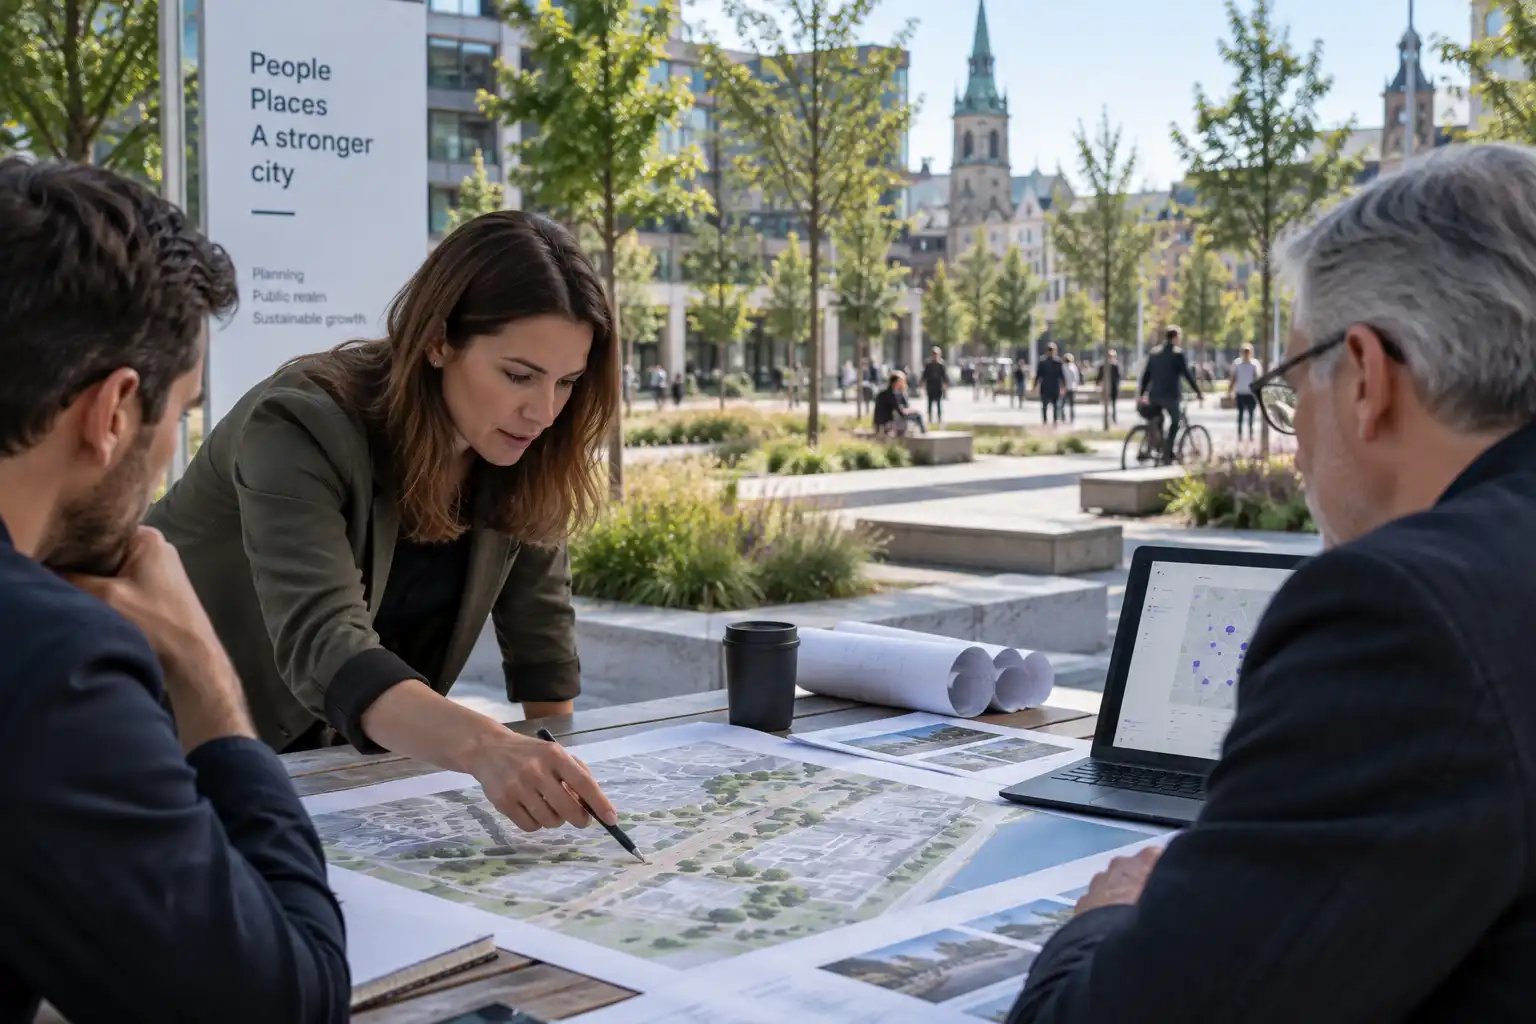
Use consistent measurement over time to compare places and see how activity patterns develop around changes to the physical urban environment.
CITY LIFE & CITY CENTRE
FOR A CLEARER CITY-CENTRE PICTURE
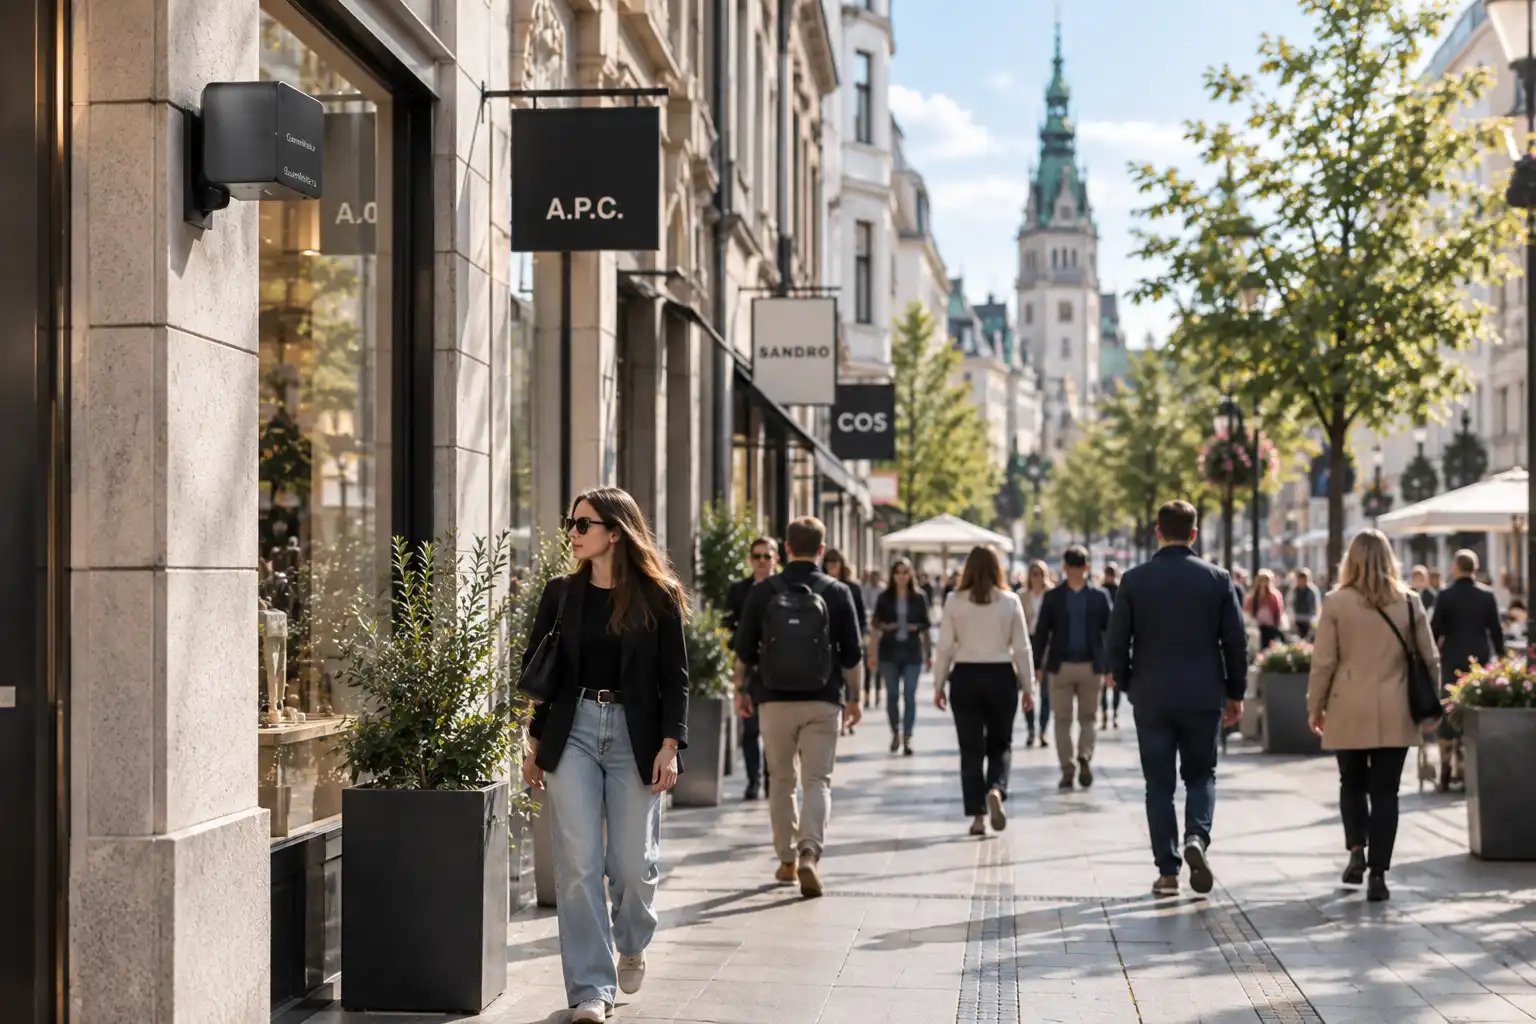
Compare shopping streets, squares and other measured areas to see how activity varies across the week, year and different parts of the city centre.
LEADERSHIP & STRATEGY
FOR THE CITY AS A WHOLE
Build a consistent picture of how activity develops across measured places and use it as a shared evidence base for prioritisation and follow-up.
Different roles. One consistent view of activity across the city.
Tell us what you measure today, which places you want to understand better and which questions need a stronger data foundation. We’ll look at how CountMatters could fit.
See when and where activity is highest and how patterns develop over time.
Compare streets, squares and other measured areas on the same data foundation.
See how activity develops across periods and around relevant interventions or changes in the city.
Tell us briefly which places you want to measure or understand better. We’ll get in touch for a focused conversation about your needs.
A short conversation. No obligation.