
Visitor analytics for sports & events

See how visitor traffic changes from event to event.

Measure visits at relevant entrances, see when traffic is highest and compare patterns across events and periods. Build a consistent data foundation for understanding how your venue is used over time.

01
Visits

Know how many visitors come through relevant entrances.

02
Peaks

See when visitor traffic is highest during the event period.

03
Comparison

Compare visitor patterns across events and over time.

Talk to CountMatters
Industries - Sport & Events  - Section Hero

FROM ATTENDANCE TO TRAFFIC PATTERNS

Almost the same attendance. A very different traffic pattern.

The total shows how many visits were measured. Traffic throughout the event period shows when those visits occurred and how concentrated the activity was.

EVENT A 18,420 measured visits
GRADUAL BUILD-UP
16:00 18:00 20:00 22:00

Visitor traffic is distributed over a longer period before reaching its highest level.
EVENT B 18,360 measured visits
CONCENTRATED PEAK
16:00 18:00 20:00 22:00

Almost the same total number of visits, but more of the traffic is concentrated into a shorter period.

The total is the starting point. The traffic pattern shows how visits are distributed over time.

FROM VISITOR DATA TO BETTER QUESTIONS

What do you need to understand about traffic around your events?

Attendance is the starting point. When you track traffic throughout the event period, across entrances and between events, it becomes easier to see patterns and differences worth investigating further.

01

When is traffic highest?

See how visits are distributed throughout the event period, when traffic increases and when it reaches its highest level.

02

Which entrances are used most?

Compare measured entrances to see how visitor traffic is distributed across relevant measurement points.

03

How do events differ from one another?

Compare events on the same data foundation to see differences in attendance, timing and traffic patterns.

04

How are traffic patterns developing over time?

Track events over longer periods to see which patterns repeat, what changes and which differences stand out.

FROM ENTRANCE TO EVENT HISTORY

See every event in context.

Start with visits at relevant entrances. See how traffic is distributed throughout the event, then compare multiple events on the same data foundation to track patterns and development over time.

Industries - Sport & Events  - Section 2 - measure_image
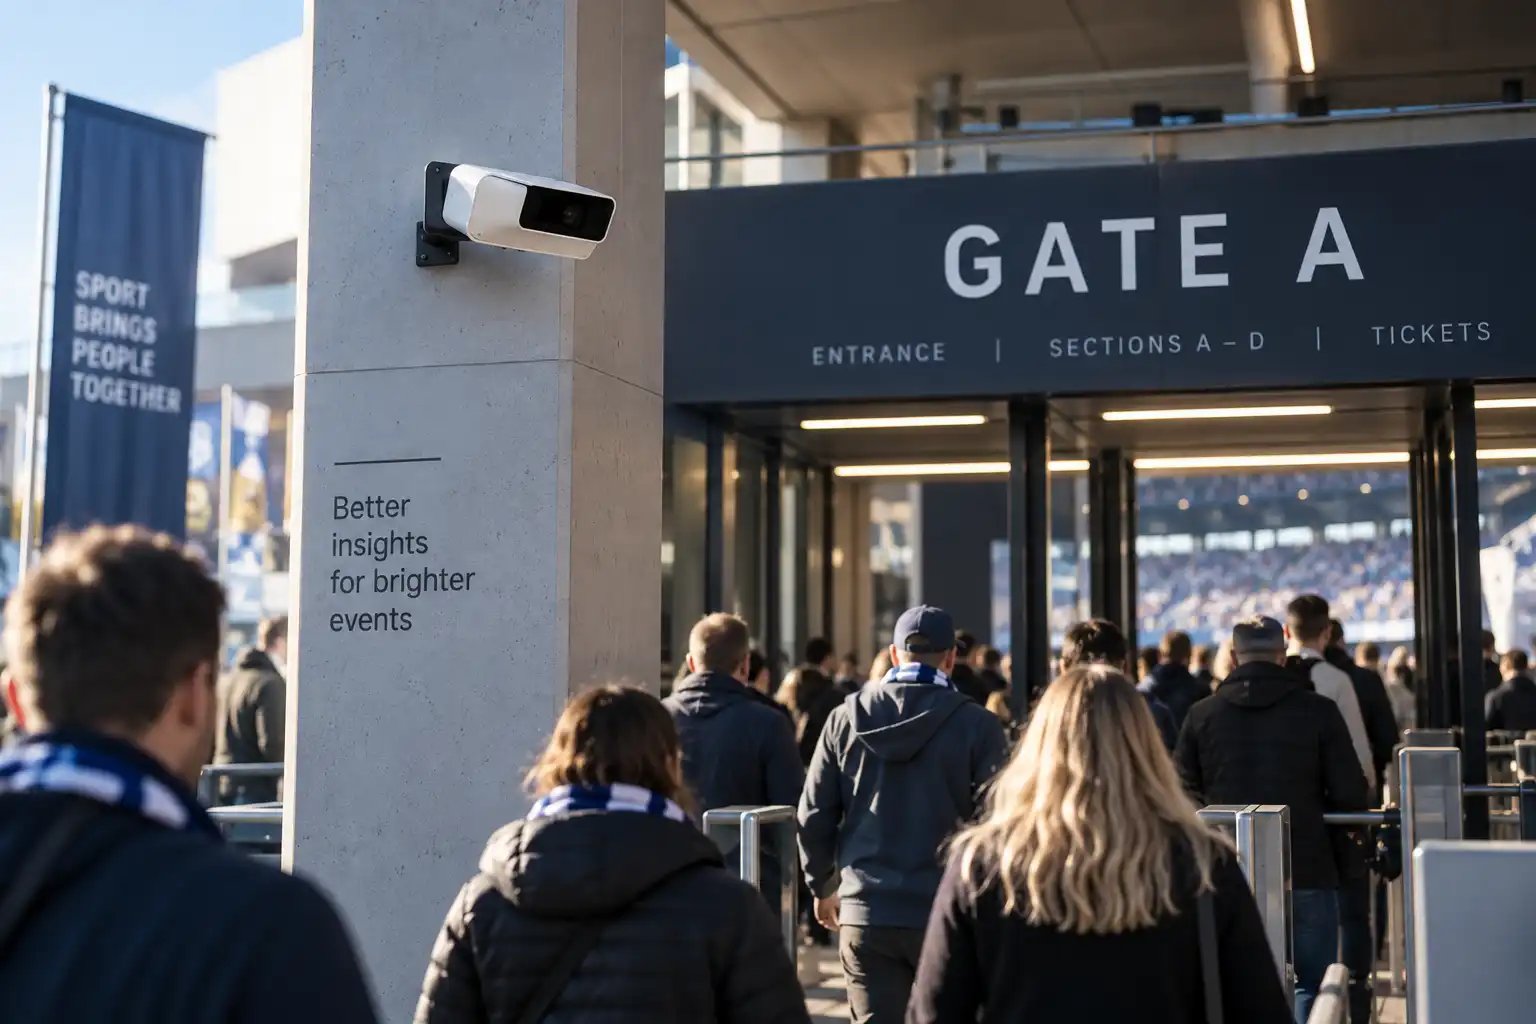
MEASURED ENTRANCE Gate A 4,280 visits
01

Entrance

Measure visits at relevant entrances and see how traffic is distributed across measurement points.

Industries - Sport & Events  - Section 2 - event_image
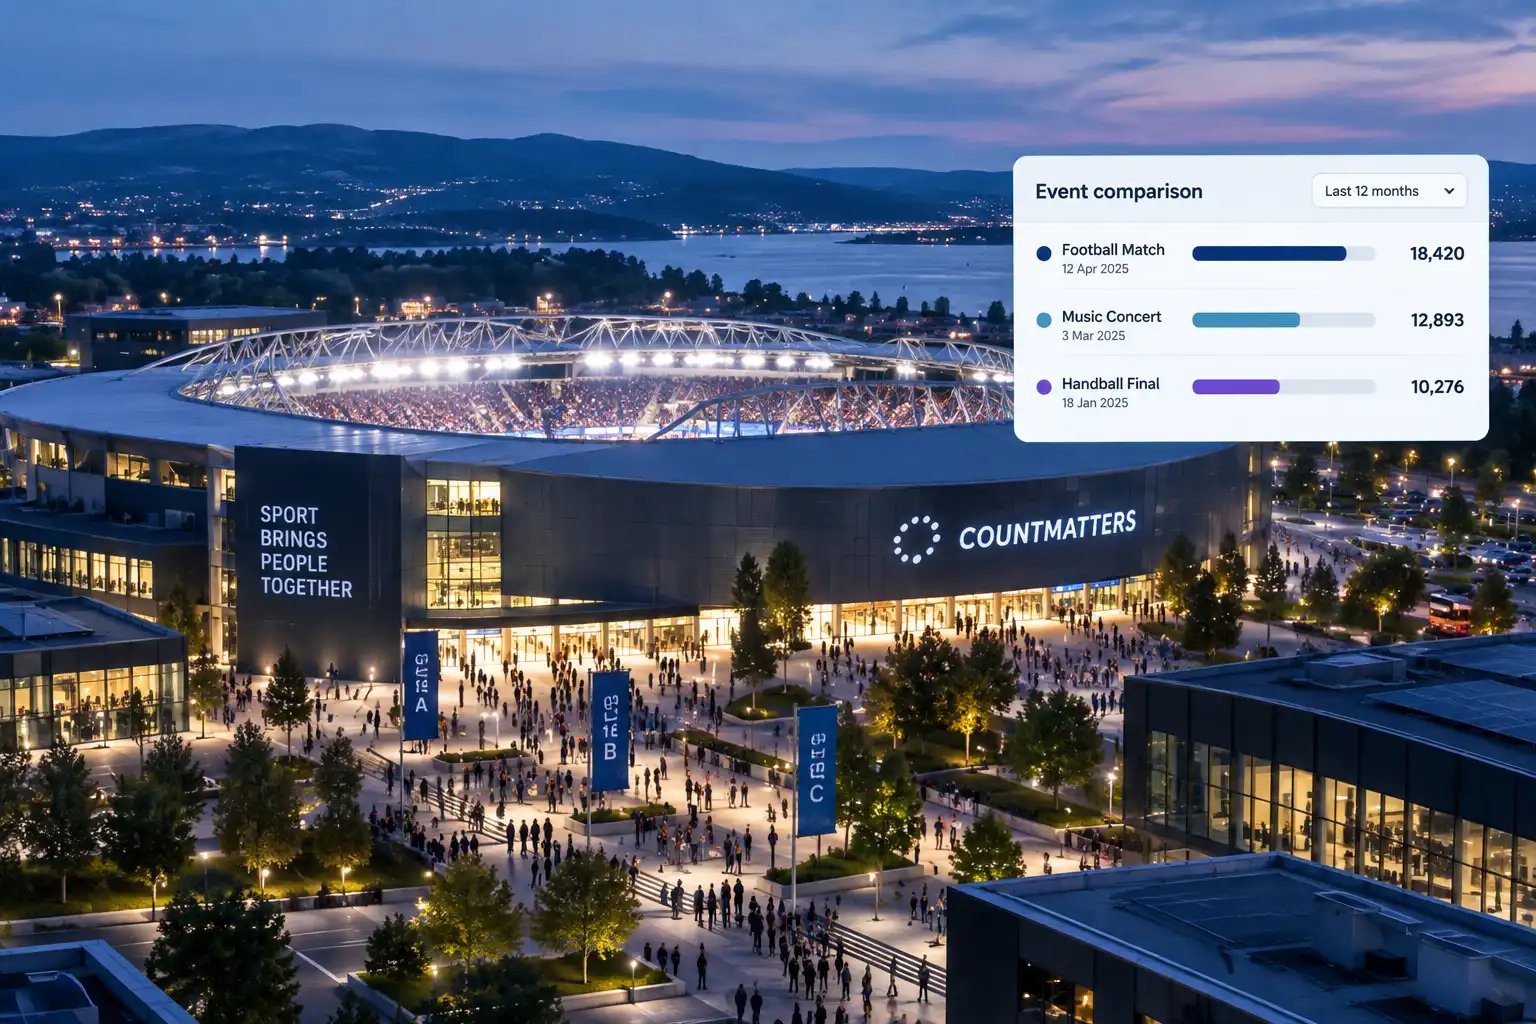
EVENT 18,420 measured visits
02

Event

See when visits occur, when traffic is highest and how the pattern develops throughout the event period.

Industries - Sport & Events  - Section 2 - venue_image
COMPARE EVENTS
03

Multiple events

Compare events on the same data foundation to see differences, recurring patterns and development over time.

From one entrance to multiple events. The same consistent data foundation.

FROM COUNTING TO UNDERSTANDING

Start with the count. Go deeper when you need to.

CountMatters builds on one common data foundation — from reliable visitor measurement to analysis of traffic patterns and more context on how the venue is used.

Industries - Sport & Events  - Section 2 - measure_image 01
MEASURE

Know how many visitors come.

Measure visits at relevant entrances and establish a consistent data foundation for volume, time and place.

VOLUME · TIME · PLACE
Industries - Sport & Events  - Section 2 - analyse_image 02
ANALYSE

See what changes from event to event.

Compare periods, entrances and events to see differences in attendance, timing, peaks and traffic patterns.

PERIODS · EVENTS · PATTERNS
Industries - Sport & Events  - Section 2 - understand_image 03
UNDERSTAND

Add more context when you need it.

Where supported, zones, dwell time, movement patterns and other relevant data can provide a deeper picture of how the venue and different areas are used.

ZONES · DWELL TIME · MOVEMENT

Start with what you need today. Build further on the same data foundation.

THE SAME DATA. DIFFERENT QUESTIONS.

One data foundation across the venue organisation.

Operations, venue management, commercial teams and leadership look at visitor data from different perspectives. A consistent data foundation lets them work with different questions without losing the shared picture of visitor traffic.

Industries - Sport & Events  - Section 5 - decicions_image
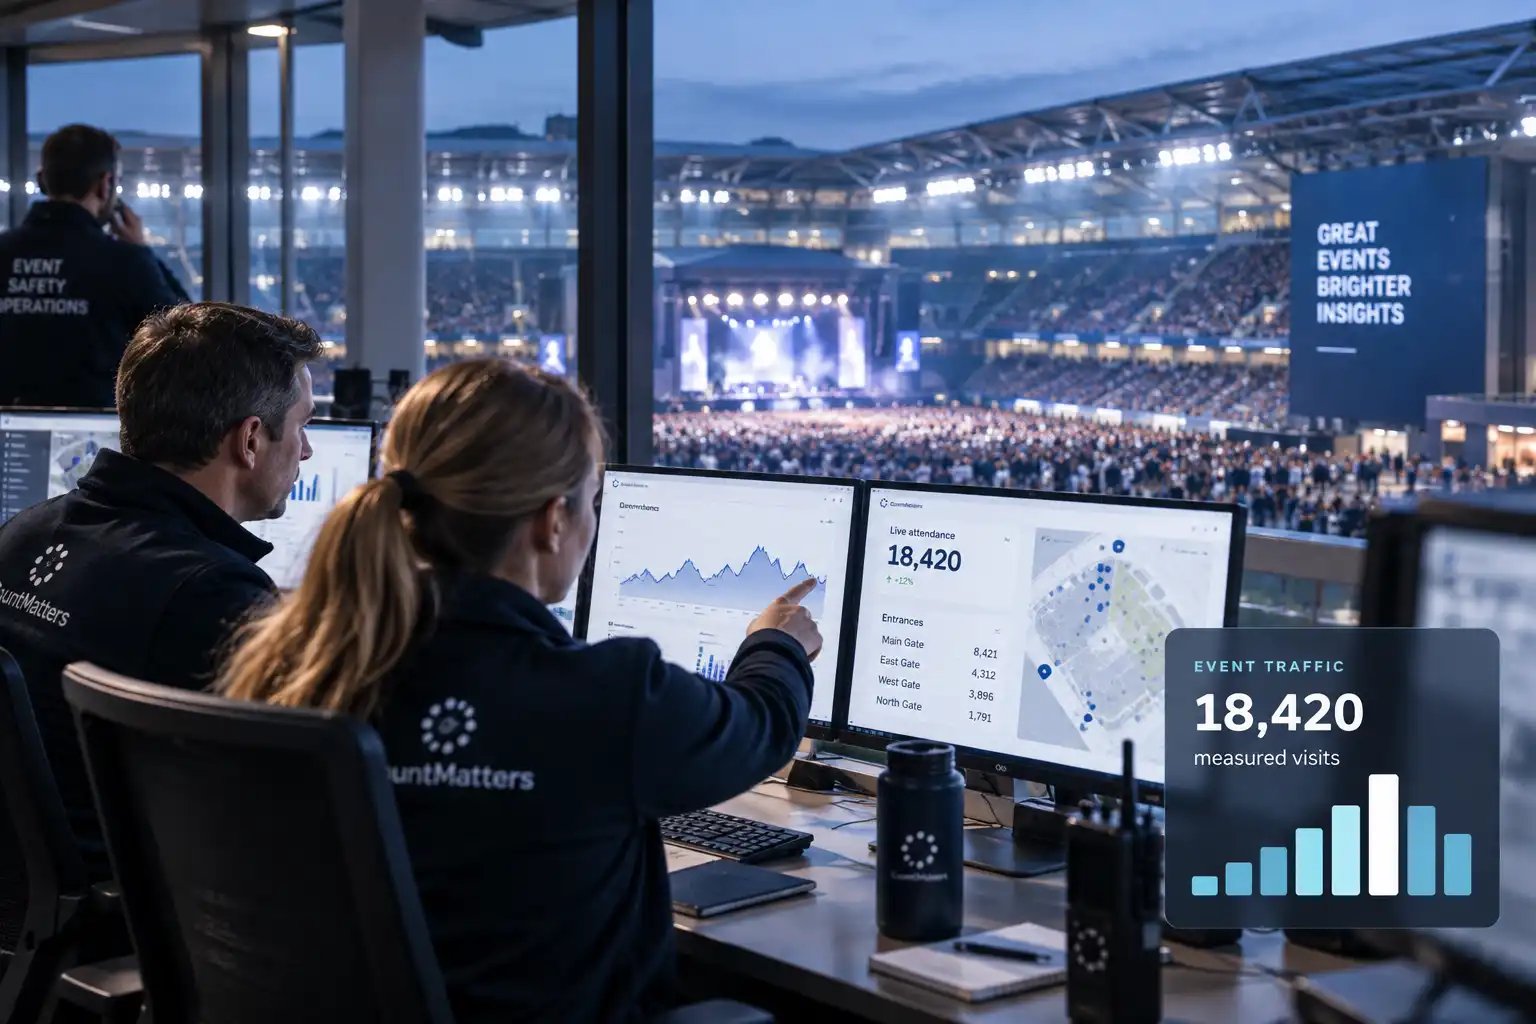
EVENT TRAFFIC 18,420 measured visits
FOR OPERATIONS

See when and where visitor traffic is highest.

Track traffic throughout the event period and compare relevant entrances to create a clearer data foundation for operational planning.

When does traffic begin to increase? When is traffic highest? Which entrances are used most?
FOR VENUE MANAGEMENT

See how traffic patterns develop across events.

Compare events and periods on the same data foundation to see recurring patterns, differences and changes over time.

Which traffic patterns repeat? Where do events differ? How are patterns changing over time?
FOR EVENT & COMMERCIAL

Compare events on a consistent basis.

See how attendance, timing and traffic patterns vary across events and periods. This provides a clearer basis for seeing what changed — without assuming why.

How does attendance differ? How do traffic patterns vary? What changed from previous events?
FOR LEADERSHIP

Track development across events and over time.

Use the same data foundation to track visits and patterns over longer periods and see where development stands out and deserves closer investigation.

How is attendance developing? Which patterns repeat? Where should we investigate further?

The same visitor data. Different questions. One consistent data foundation.

VISITOR ANALYTICS FOR SPORTS & EVENTS

What do you need to understand about your visitor traffic?

Tell us about your venue, events and the questions you are trying to answer. We’ll show you how CountMatters can provide a consistent data foundation for visits, traffic patterns and development over time.

01
Measure visits

Establish consistent measurement across relevant entrances and events.

02
See traffic patterns

See when traffic is highest and how visits are distributed throughout the event period.

03
Compare events

Track development on the same data foundation and see where attendance and traffic patterns differ.

START THE CONVERSATION

What do you need to measure?

Leave your company and email, and we’ll get in touch to clarify which events, entrances and questions are relevant to you.

A short conversation. No obligation.

TURN CROWD FLOW INTO PERFORMANCE DATA

Trusted by entertainment leaders for over 30 years, CountMatters turns visitor movement into data-driven decisions that boost safety, streamline operations, and maximize audience impact.

Curious how it could work at your venue?

Book a 15-minute walkthrough—just fill out the short form and we’ll show you what’s possible.