
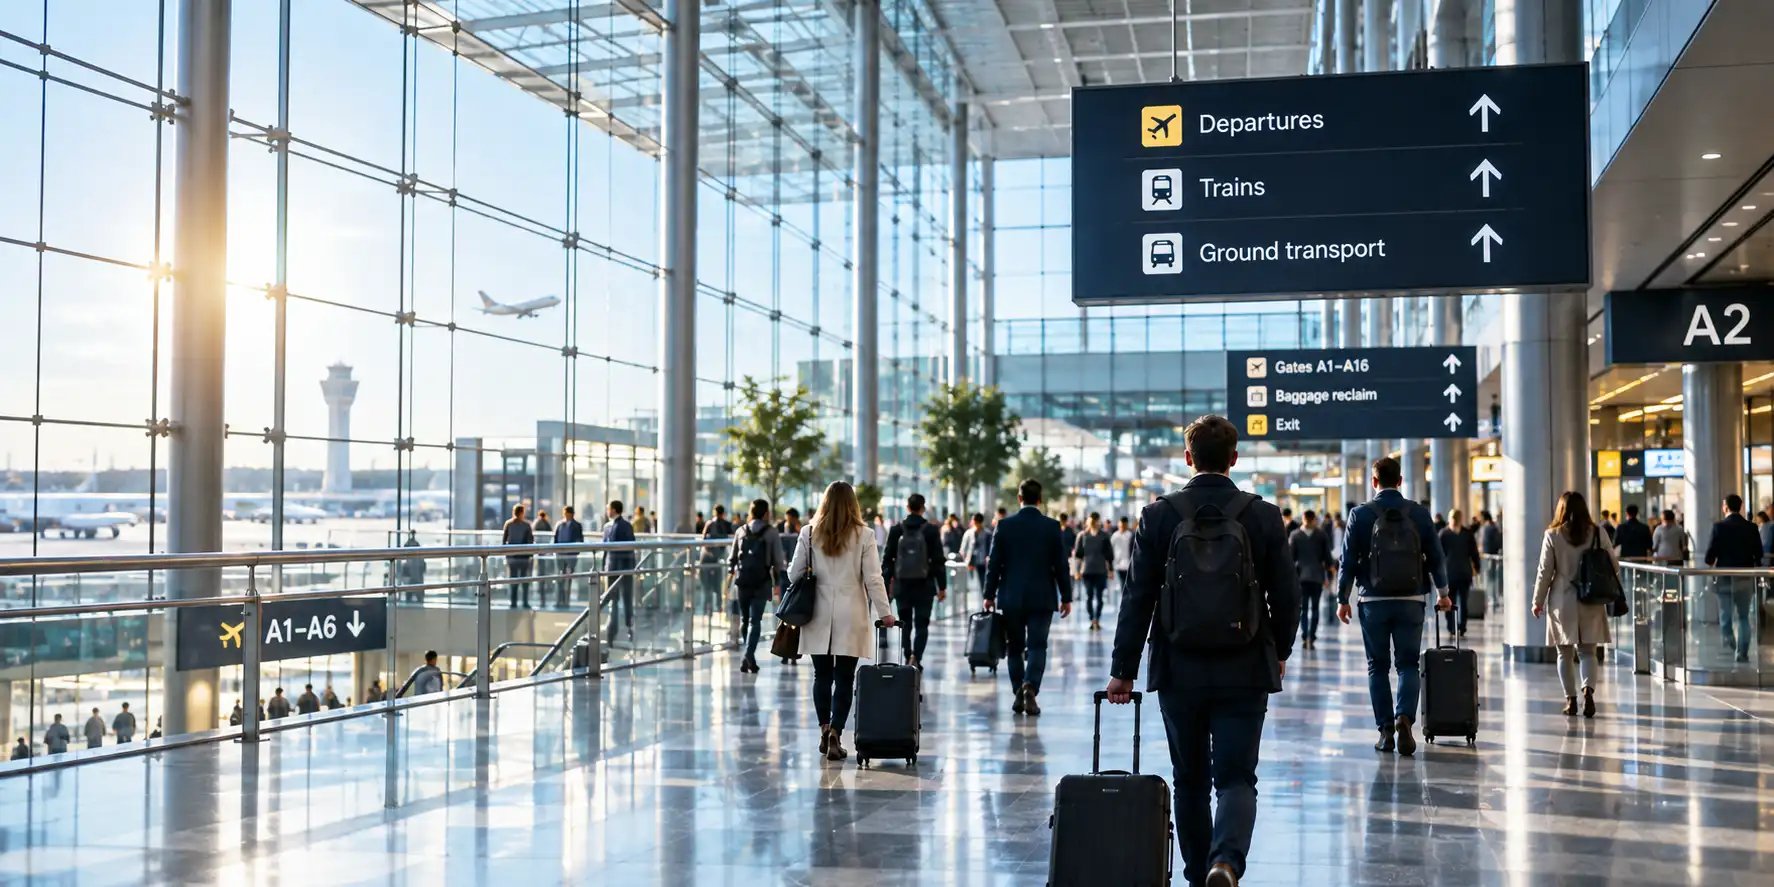
Visitor analytics for transport & airports

Understand how passenger traffic moves through your transport environment.

Measure passenger traffic across entrances and locations. See when and where traffic is highest, how patterns change and which differences deserve closer investigation.

Traffic See how many passages are recorded at measured locations.
Patterns See when and where traffic patterns change.
Peak periods Identify when passenger traffic is highest.
Industries - Transport  - Section Hero

SEE BEYOND THE TOTAL

A daily total doesn’t tell you when traffic peaks occur.

Two periods can record almost the same traffic volume even when passenger traffic is distributed very differently throughout the day. See the total, the peaks and the pattern between them.

Volume Distribution Traffic peaks
CONCENTRATED TRAFFIC 12,400 recorded passages
Peak 07:00–09:00

A short, pronounced peak concentrates more of the traffic into the same period.
DISTRIBUTED TRAFFIC 12,600 recorded passages
Spread over 5 hrs

A similar volume is distributed more evenly across several hours.

Almost the same volume. Very different traffic patterns throughout the day.

FROM TRAFFIC TO UNDERSTANDING

Turn passenger traffic into questions you can answer.

When traffic is measured consistently over time and across locations, you can see when peaks occur, where patterns differ and which changes deserve closer investigation.

01

When are our busiest periods?

See how traffic is distributed across hours, days and longer periods, and identify when passenger traffic is highest.

IDENTIFY Peaks · Busy periods · Variations
Passenger traffic by hour
00 04 08 12 16 20
02

Where is traffic changing most?

Compare measured entrances, areas or locations over the same period to see where development differs.

COMPARE Entrances · Areas · Locations
Change vs. previous period
Terminal A +12%
Terminal B +4%
Terminal C −8%
Train station +18%
Car park +6%

Illustrative example

03

How are traffic patterns developing over time?

Track development over time to distinguish short-term variation from more persistent changes in traffic.

TRACK Days · Weeks · Seasons · Years
Daily passenger traffic +24% vs. last year

Illustrative example

04

How did traffic change around an operational change?

Compare traffic before, during and after changes to timetables, access, infrastructure or other relevant conditions.

COMPARE Before · During · After
Passenger traffic
Traffic pattern changed over the period

Illustrative example — shows change, not causation

The count is the starting point. The value comes from seeing when, where and how traffic changes.

FROM MEASUREMENT POINT TO NETWORK

See each location in context.

A single traffic number shows only part of the picture. Compare measured entrances and areas within a location — and traffic development across multiple locations when your organisation requires it.

MEASUREMENT POINT

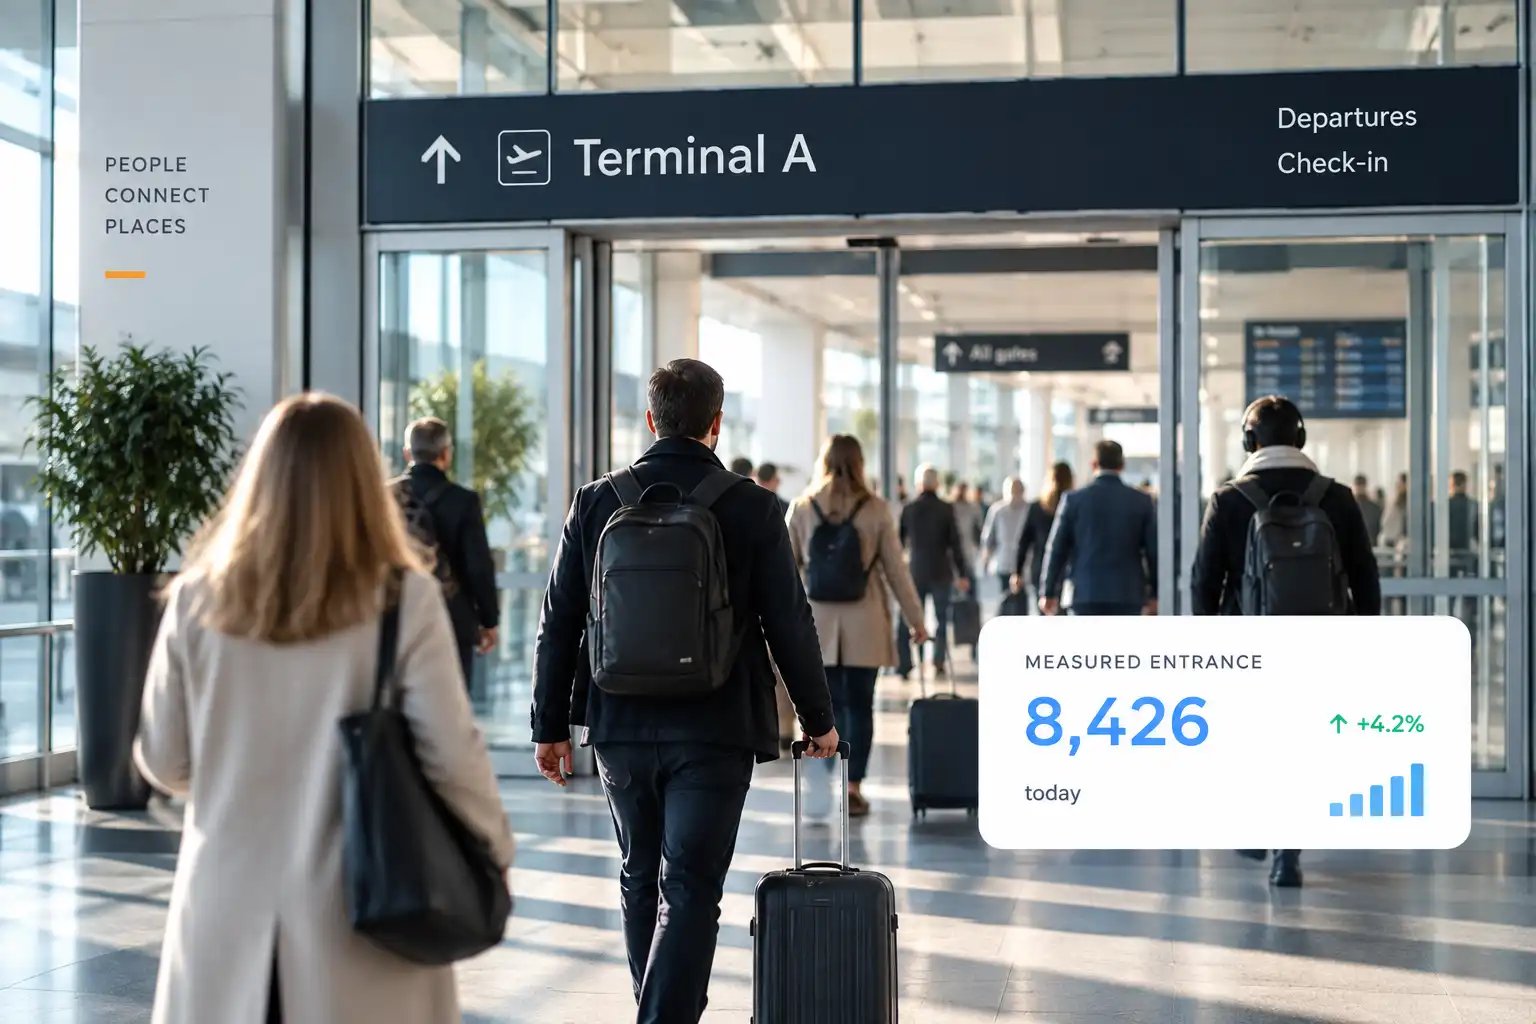
Measure traffic where passengers pass.

Measure traffic at relevant entrances and other measurement points to establish a consistent picture of volume and development over time.

Industries - Transport  - Section 3 - Access image
ENTRANCE A
PASSENGER TRAFFIC
8,426 +4.2%
today vs. previous period

LOCATION

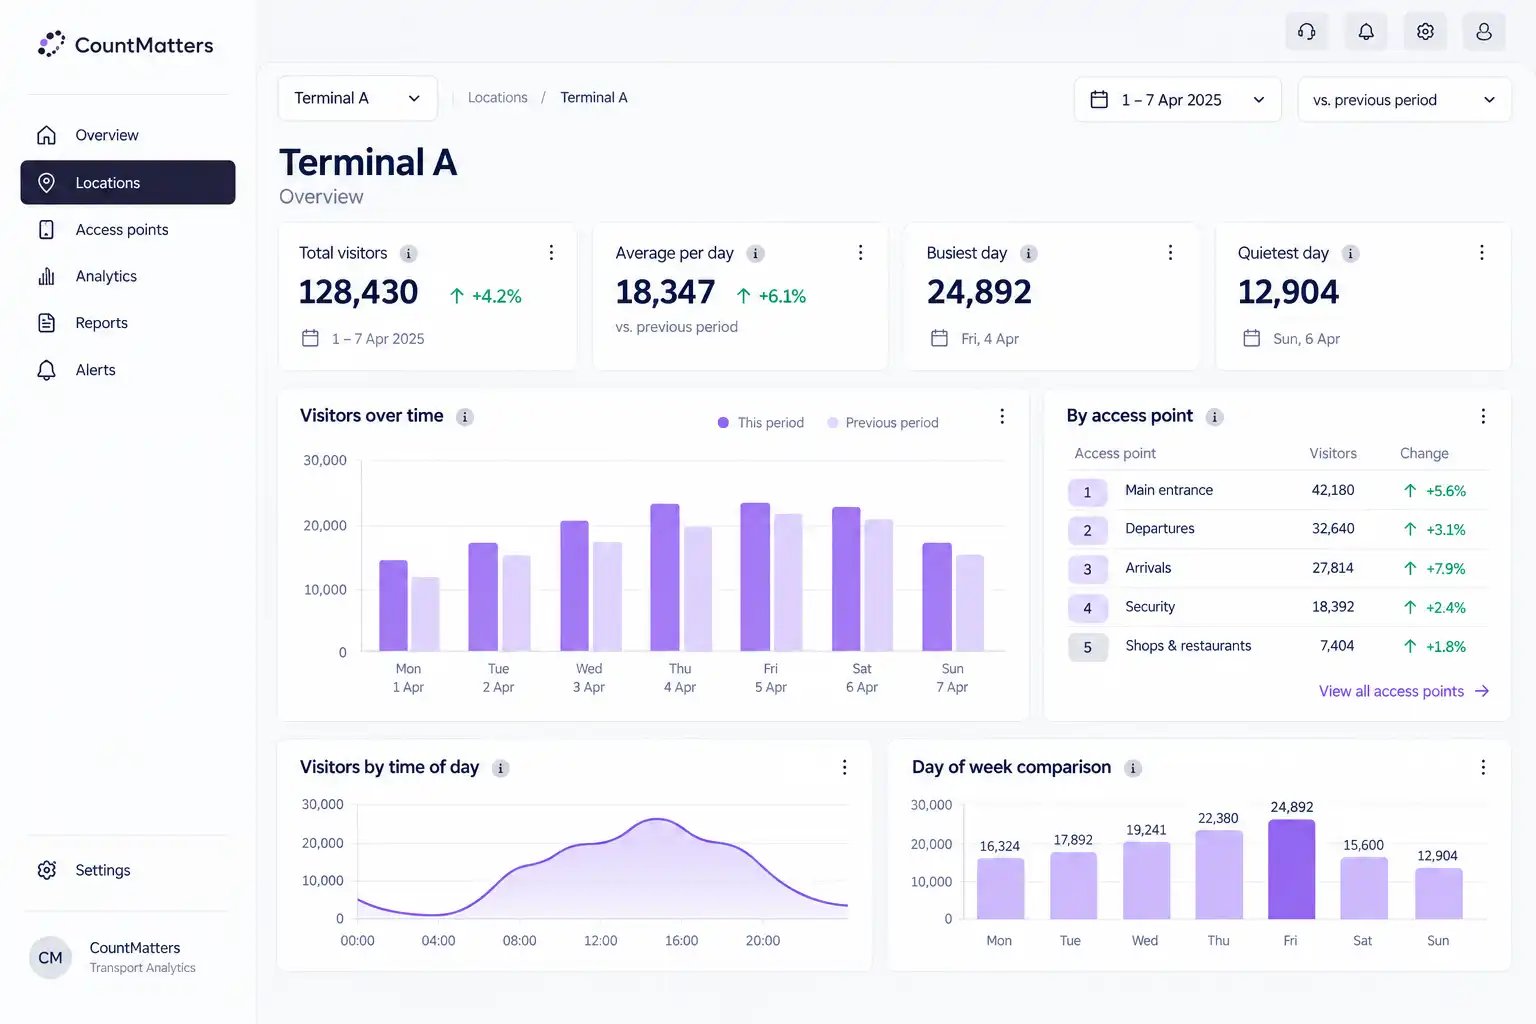
See how traffic varies across the location.

Compare measured entrances, areas or other relevant points to see where traffic patterns vary.

Industries - Transport  - Section 3 - analytics_image
Compare measurement points

NETWORK

Compare development across locations.

For organisations with multiple locations, consistent measurement provides a common basis for comparing traffic development and seeing where the differences are greatest.

NETWORK OVERVIEW Traffic development
vs. previous period
A
Location A Transport hub
+6.4%
B
Location B Terminal
+2.1%
C
Location C Station
−1.8%

The goal is not to rank locations. It is to understand how traffic develops differently — and where to look more closely.

Illustrative data examples

FROM COUNTING TO UNDERSTANDING

Start with the count. Go deeper when you need to.

CountMatters builds on a common data foundation — from reliable counting to traffic pattern analysis and a deeper understanding of how people use the location.

Industries - Transport  - Section 3 - Measure
MEASURED ENTRANCE 8,426 today
MEASURE

People Counting

Know how many people pass.

Count passengers and visitors at relevant entrances and measurement points to establish a consistent traffic baseline.

Industries - Transport  - Section 3 - analyse_image
ANALYSE

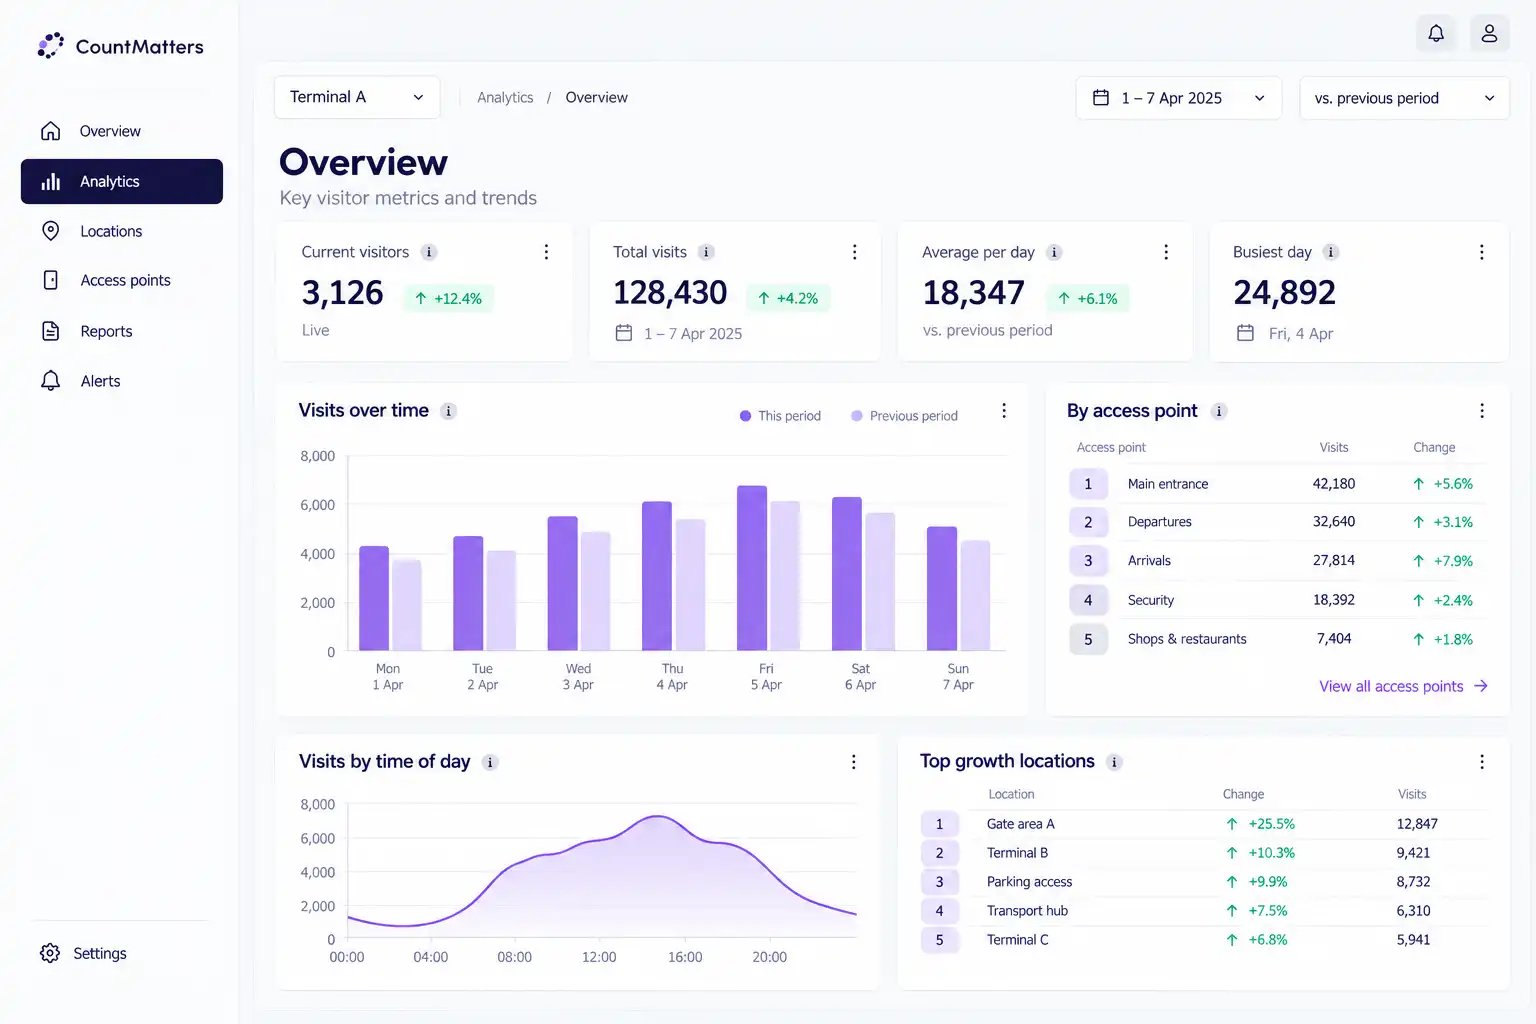
Footfall Analytics

See when and where traffic changes.

Compare periods, measurement points and locations to identify peaks, trends and differences in traffic patterns.

Industries - Transport  - Section 3 - understand_image
UNDERSTAND

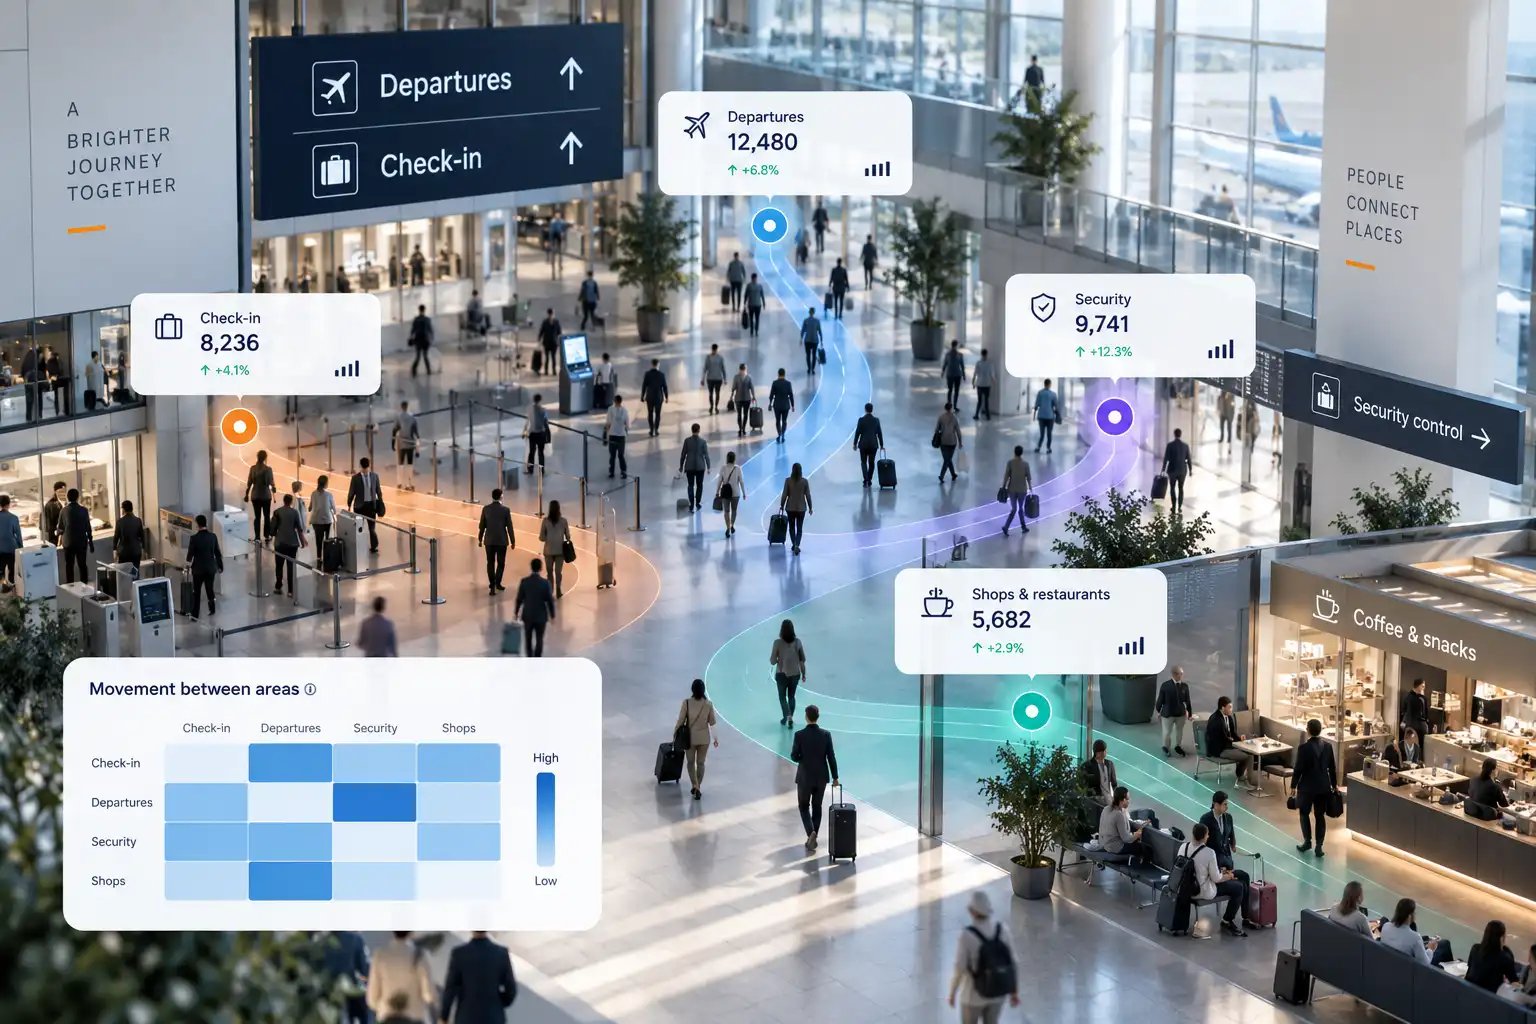
Visitor Intelligence

Understand how people use the location.

Where supported, zones, dwell time, movement patterns and relevant business data can add more context to traffic and how the location is used.

Start with what you need today. Build further on the same data foundation.

BUILT FOR TRANSPORT OPERATIONS

One data foundation. Different decisions.

The same traffic data can support different questions across the transport organisation — from daily operations and long-term planning to commercial areas and leadership.

Industries - Transport  - Section 3 - Measure
BUSY PERIOD 07:30–09:00 Highest measured traffic

OPERATIONS & TERMINAL MANAGEMENT

Plan around when and where traffic is highest.

Use traffic patterns as a data foundation for planning around busy periods, comparing measured points and seeing where changes deserve closer investigation.

QUESTIONS THE DATA CAN SUPPORT
  • When are our busiest periods?
  • Where is measured traffic highest?
  • Where are traffic patterns changing?

Different teams. Different questions. One consistent data foundation.

START WITH WHAT YOU NEED TO UNDERSTAND

What do you need to understand about passenger traffic?

Tell us what you measure today, which locations or measurement points you have, and which questions you need better answers to. We’ll look at how CountMatters can provide a more consistent data foundation.

01
Understand traffic peaks

See when passenger traffic is highest and how patterns change throughout the day and over time.

02
Compare locations

Compare measured entrances, areas and locations on the same data foundation to see where traffic develops differently.

03
Plan with better data

Give operations, planning and leadership a consistent view of traffic patterns as a basis for further decisions.

TALK TO US

Let’s look at your transport environment.

Tell us how you measure passenger traffic today and what you want to understand better. We’ll look at what could be relevant for your locations.

A short conversation. No obligation.

TURN PASSENGER FLOW INTO SMARTER OPERATIONS

Trusted by transport authorities for over 30 years, CountMatters turns real-time movement data into decisions that improve safety, reduce wait times, and elevate the transit experience.

Curious how it works?

Book a 15-minute walkthrough and see the platform in action—just fill out the short form to get started.