
Demand changes
Visitor arrivals are rarely evenly distributed throughout the day. Periods of higher demand can quickly change conditions in a service area.

QUEUE MONITORING
Measure queue development and waiting times continuously. See when pressure builds, compare periods and understand how waiting patterns change throughout the day.
THE OPERATIONAL CHALLENGE
A queue can build quickly, disappear just as fast and look completely different an hour later. Without continuous measurement, it is difficult to know whether what you see is typical, temporary or part of a recurring pattern.
Visitor arrivals are rarely evenly distributed throughout the day. Periods of higher demand can quickly change conditions in a service area.
Queue length and waiting time change throughout the day as demand rises and falls.
Comparing periods makes it easier to see when pressure regularly builds and where closer attention may be needed.
QUEUE MONITORING WITH COUNTMATTERS
CountMatters continuously measures queue activity, showing how conditions change throughout the day and across periods. See what is happening now, analyse how it develops and understand the patterns behind it.
Track queue length and waiting time throughout the day — not just at individual moments.

Compare development through the day and between relevant periods.
Recognize when pressure regularly builds and which patterns keep returning.
The pattern is visible across multiple weeks.
WHAT QUEUE MONITORING MEASURES
Queue Monitoring builds a continuous picture of demand and waiting conditions. Measure how queues form, how long visitors wait and how conditions change throughout the day.
See how many people are waiting and how the queue develops over time.

Measure how long visitors wait before reaching the service point.
See when arrivals increase, when pressure builds and when conditions return to normal.
Compare days and periods to understand when similar queue conditions recur.

WHERE QUEUE MONITORING IS USED
Queue Monitoring can be applied to measured service areas where visitor demand changes throughout the day. Understand when queues form, how waiting conditions develop and how patterns differ between periods.
 01
01
Understand how queues develop around customer service and checkout areas as visitor demand changes.
 02
02
Measure waiting conditions at relevant passenger service points and compare how demand develops across periods.
 03
03
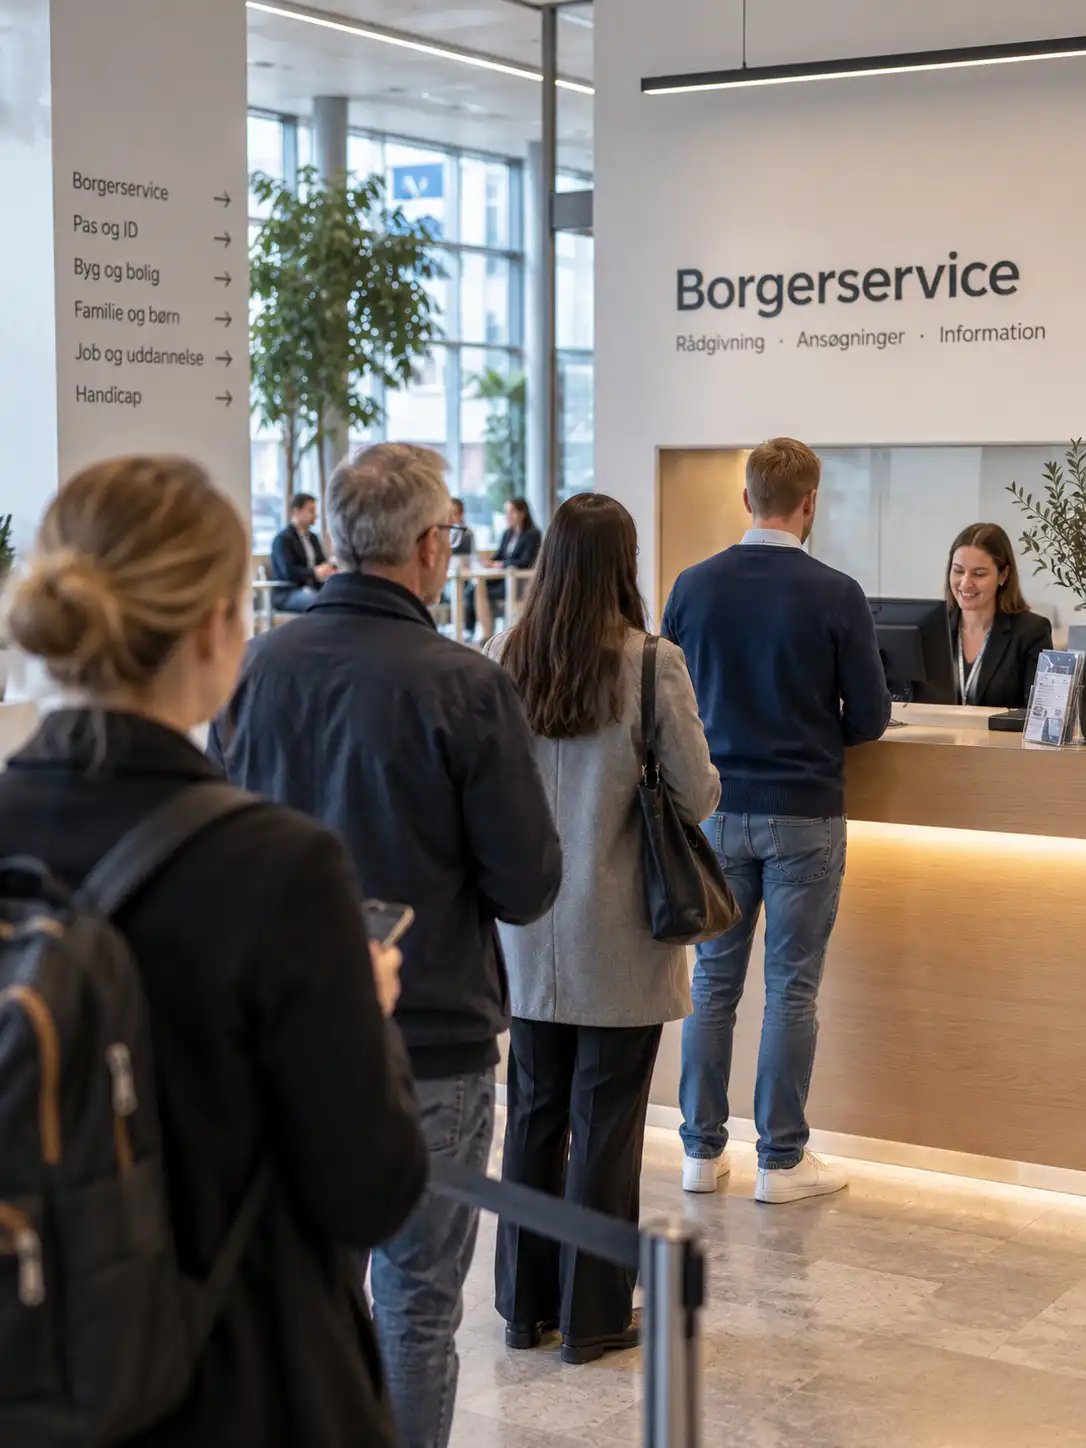
See when demand builds around reception and service areas and understand recurring patterns throughout the day.
 04
04
Understand how waiting conditions develop as visitor demand builds before, during and around events.