Visitor analytics for retail

See what happens in your stores. And how they differ. .

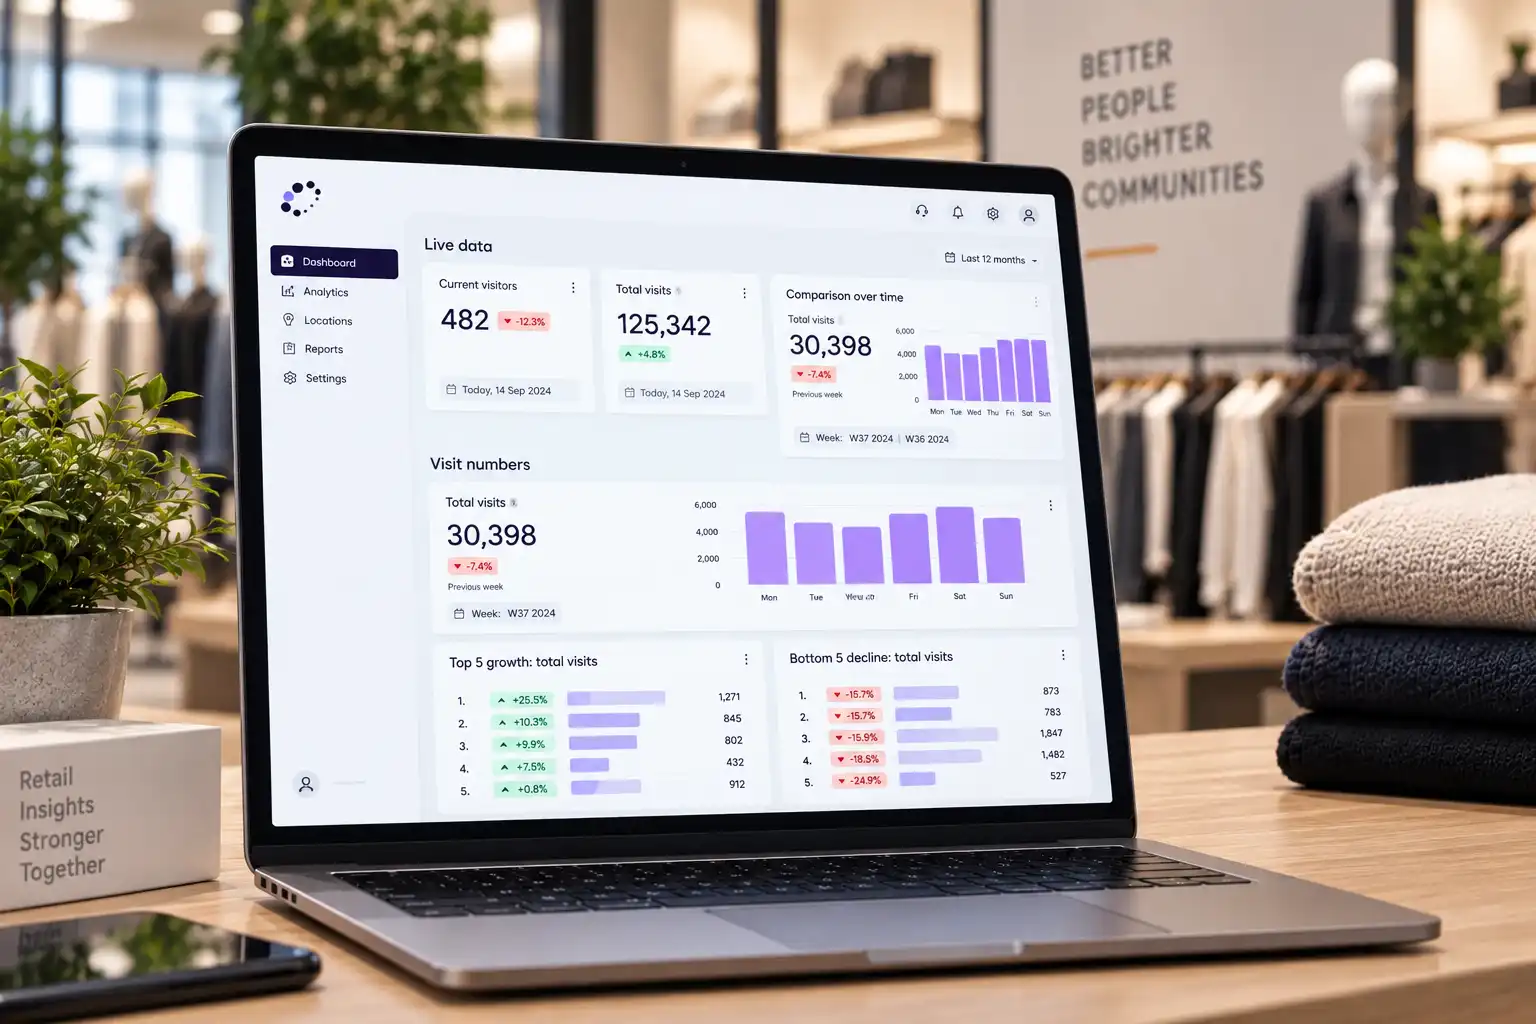
Connect visitor data with transactions and sales to see when store traffic changes, how locations develop and where it is worth looking more closely.

Store traffic See how many people visit your stores — and when.
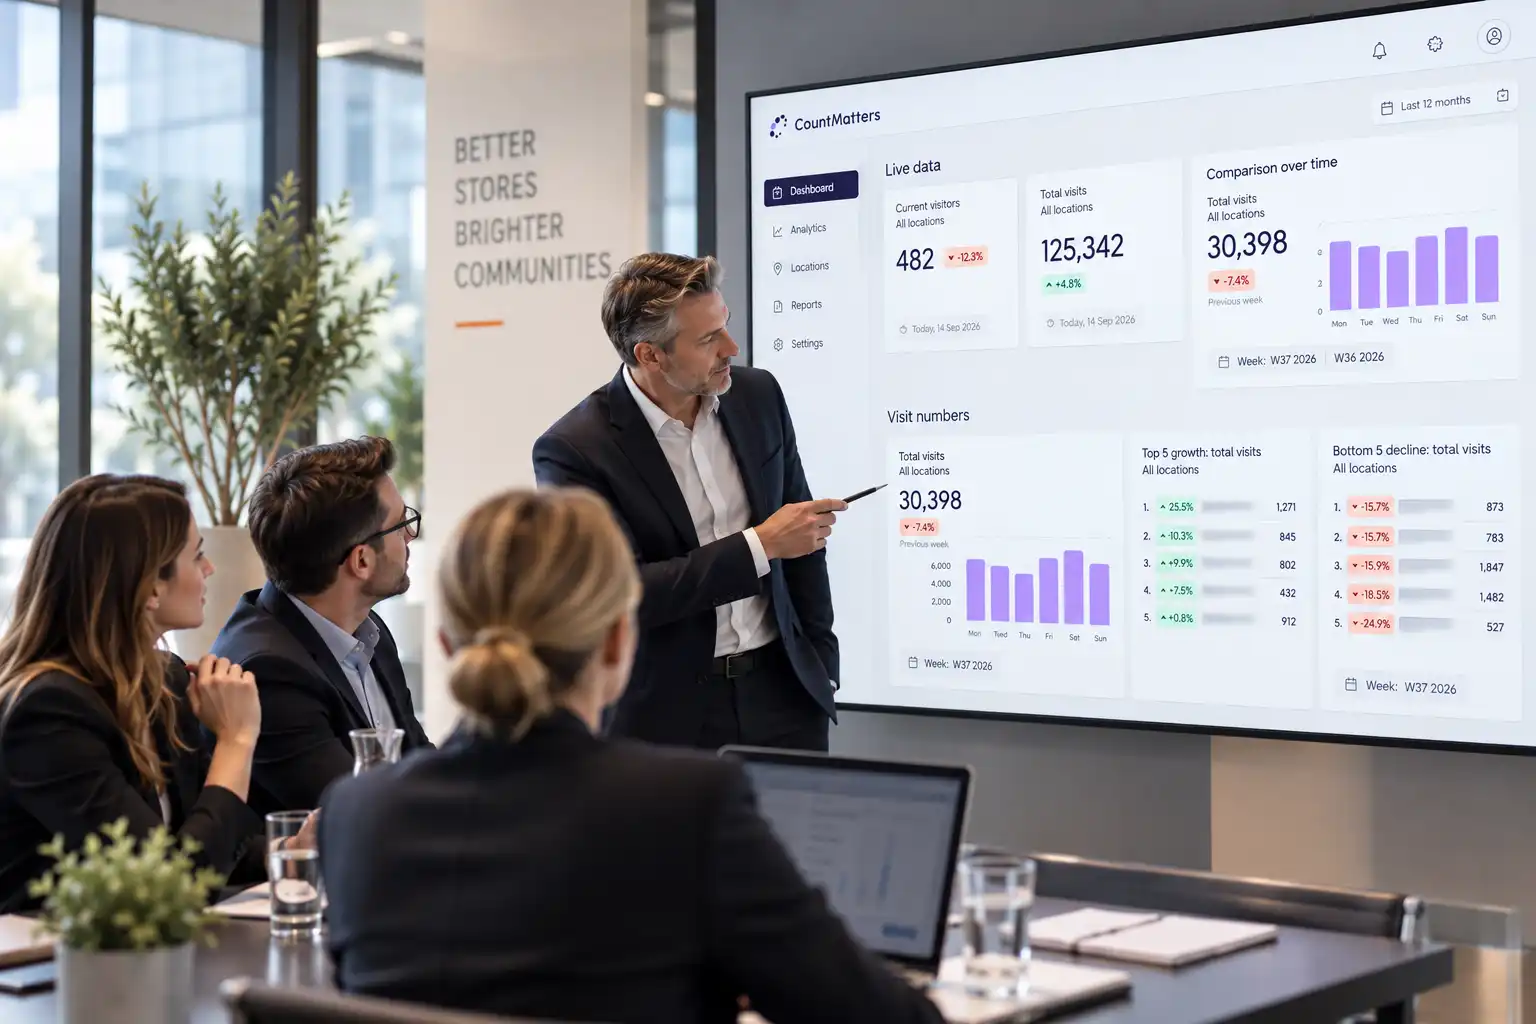
Comparison Compare stores, periods and changes over time.
Commercial context See visits, transactions and sales in context.
30+ years of visitor data
Industries - Retail - Hero
Visits today 1,284 ▲ +12% vs. last Saturday
Change by store
Brompton +18%
Westfield +6%
King's Road -4%
Conversion Rate 6.8% ▲ +0.9 pp
People in store now 42
LOOK BEYOND SALES

Sales show the result. Visitor data shows what sits behind it.

Two stores can deliver similar sales with very different traffic and conversion figures. Looking at traffic, Conversion Rate and sales together makes those differences visible.

01
TRAFFIC How many visits did the store have?
02
CONVERSION RATE What share resulted in a transaction?
03
SALES What was the sales result?

Similar sales can hide very different patterns in traffic and Conversion Rate.

SIMILAR SALES. DIFFERENT PATTERNS.
01
STORE A Higher traffic
VISITS 12,400
CONVERSION RATE 4.8%
SALES €72k

More visits, but a lower Conversion Rate.

02
STORE B Lower traffic
VISITS 9,100
CONVERSION RATE 6.2%
SALES €69k

Fewer visits, but a higher Conversion Rate.

THE POINT Similar sales. Two very different traffic and conversion profiles.

Illustrative example. Available data depends on setup and integrations.

FROM DATA TO DECISIONS

Turn store traffic into questions you can answer.

Visitor data becomes useful when it shows what is changing, where differences appear and what is worth investigating further.

Industries - Retail - section 2 - Traffic_image
+24% Store traffic
01

Is store traffic growing?

Track store traffic across hours, days, weeks and seasons to see how visit volumes change over time.

TRENDS PERIOD COMPARISON
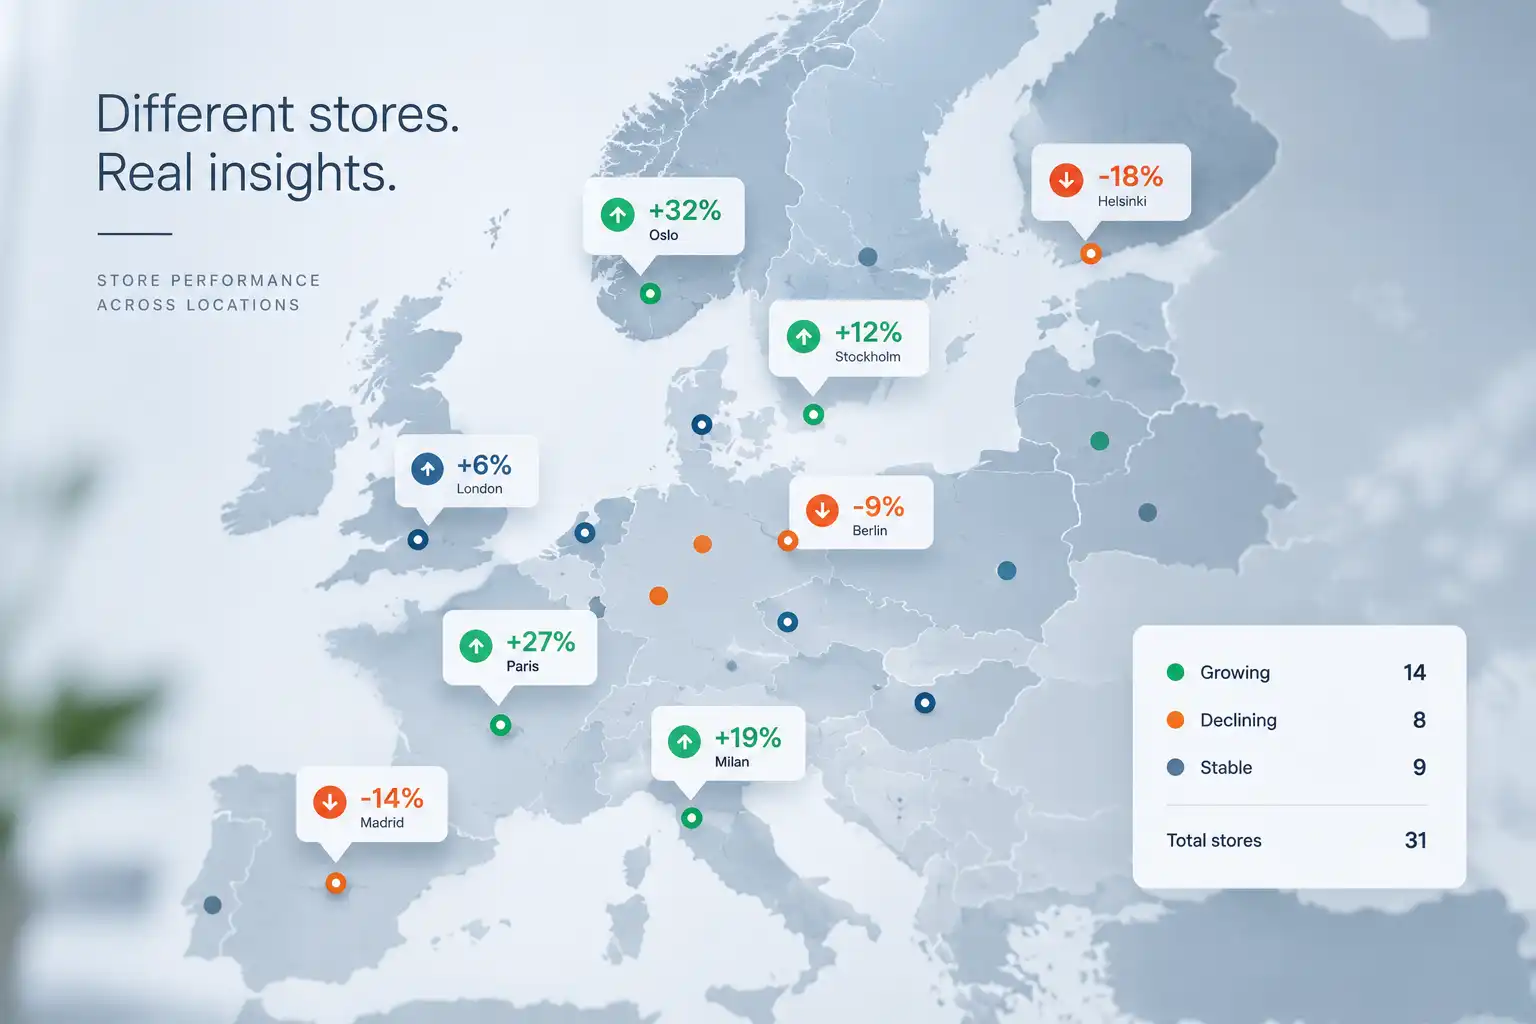
Industries - Retail - section 2 - Store comparison image
+32% -18%
02

Which stores are developing differently?

Compare locations on the same data foundation and see which stores are developing differently from the rest of the portfolio.

STORE COMPARISON DIFFERENCES
Industries - Retail - section 2 - Campaign image
+28% Store traffic
03

Did store traffic change during the campaign?

Compare store traffic before, during and after the campaign to see whether visit patterns changed over the same period.

CAMPAIGNS BEFORE / DURING / AFTER
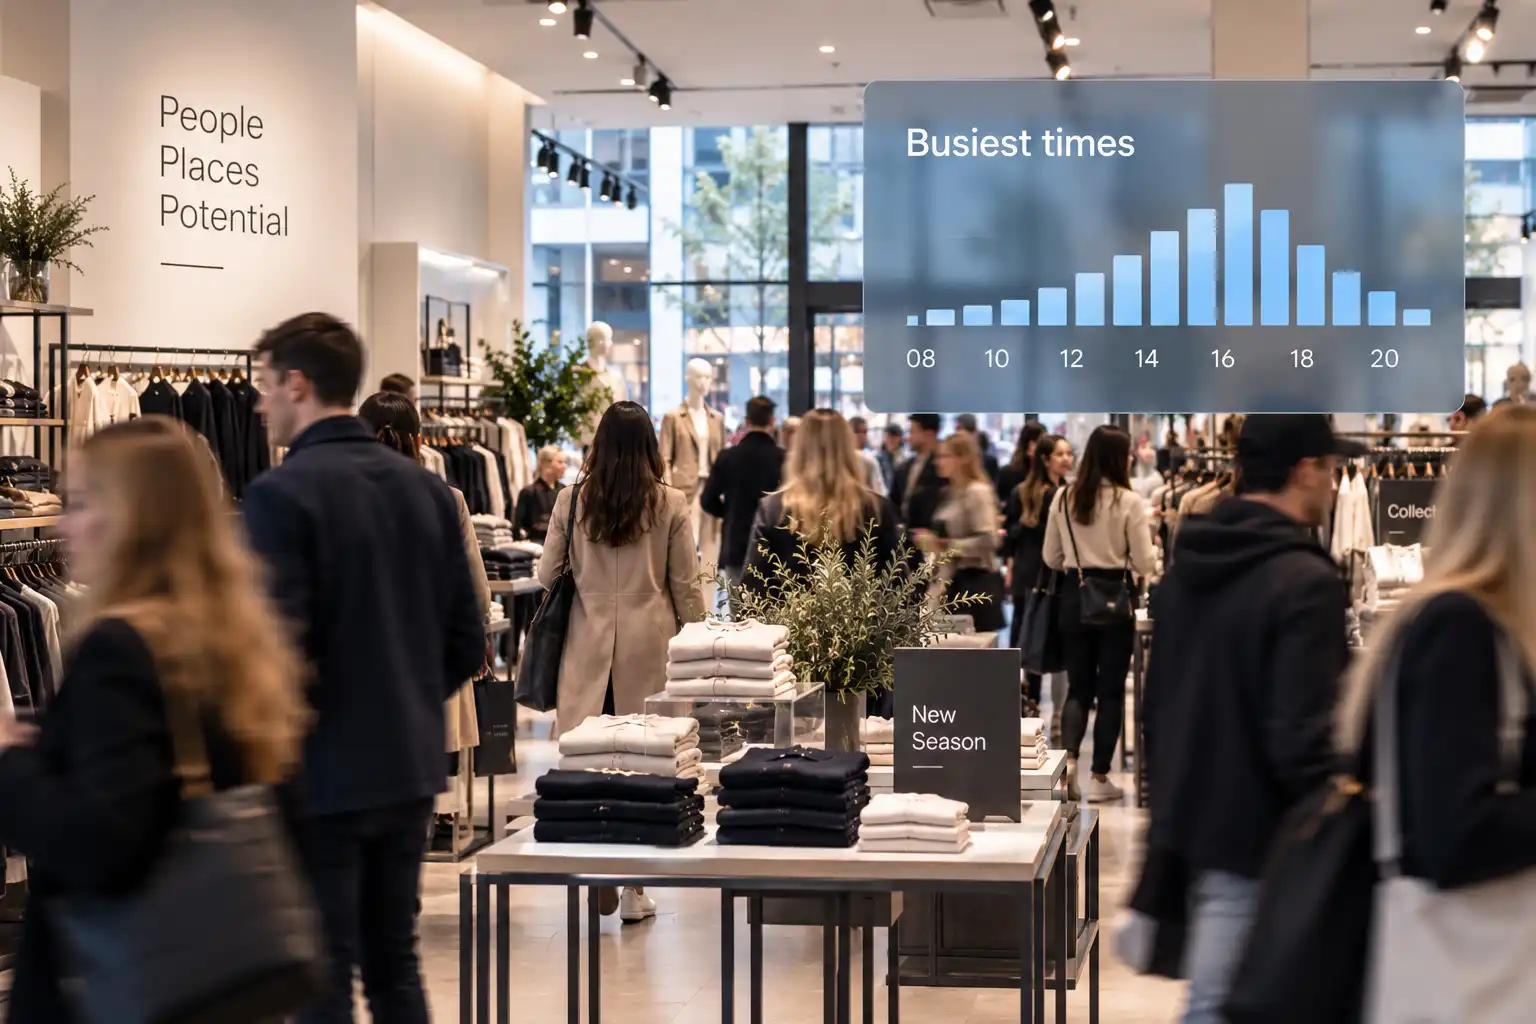
Industries - Retail - section 2 - Peak periods image
Busiest times
08 12 16 20
04

When are stores busiest?

Identify peak periods and use actual visit patterns to support staffing and operational planning.

PEAK PERIODS STAFFING
FROM ONE STORE TO THE WHOLE PORTFOLIO

See every store in context.

A single store shows what is happening there. Consistent visitor data across the portfolio shows how stores are developing in relation to each other — and where differences are worth investigating further.

01

Compare on the same basis

Use the same definitions and periods across locations.

02

See where development differs

Identify stores developing differently from the rest of the portfolio.

03

Know where to look closer

Give central and regional teams a clearer starting point for further analysis.

PORTFOLIO OVERVIEW

Store traffic

SELECTED PERIOD Last 30 days
LOCATIONS 31
PORTFOLIO TREND +4.8%
DIFFERENT DEVELOPMENT 6
STORE TRAFFIC CHANGE PORTFOLIO
Oslo City NO · 01
42,810 ↑ 8.4%
Above portfolio trend
Stockholm Central SE · 02
38,240 ↑ 2.1%
Near portfolio trend
Copenhagen DK · 03
31,670 ↓ 6.8%
Below portfolio trend
Hamburg Mitte DE · 04
29,420 ↑ 11.2%
Above portfolio trend

Illustrative view. Figures are examples and do not represent actual customer data.

The goal is not to rank stores. It is to see how they develop differently — and where to investigate further.

FROM MEASUREMENT TO MORE CONTEXT

Start with the count. Go as deep as you need.

CountMatters gives retailers a clear path from reliable counting to understanding how store traffic changes — and then to adding more context around the visit.

01 MEASURE
02 UNDERSTAND CHANGE
03 ADD CONTEXT
Industries - Retail  - Section 3 - People Counting image
IN 124
OUT 118
PEOPLE COUNTING

Measure store traffic.

Know how many people enter and leave your stores with a consistent, reliable data foundation.

ENTRY / EXIT RELIABLE FOUNDATION
EXPLORE PEOPLE COUNTING
Industries - Retail  - Section 4 - Fotfall Analytics image
FOOTFALL ANALYTICS

See how store traffic changes.

Compare locations and periods, and see peaks, trends and changes in store traffic over time.

TRENDS COMPARISON
EXPLORE FOOTFALL ANALYTICS
Industries - Retail  - Section 3 - Visitor intelligence image
VISITOR INTELLIGENCE

Add more context to the visit.

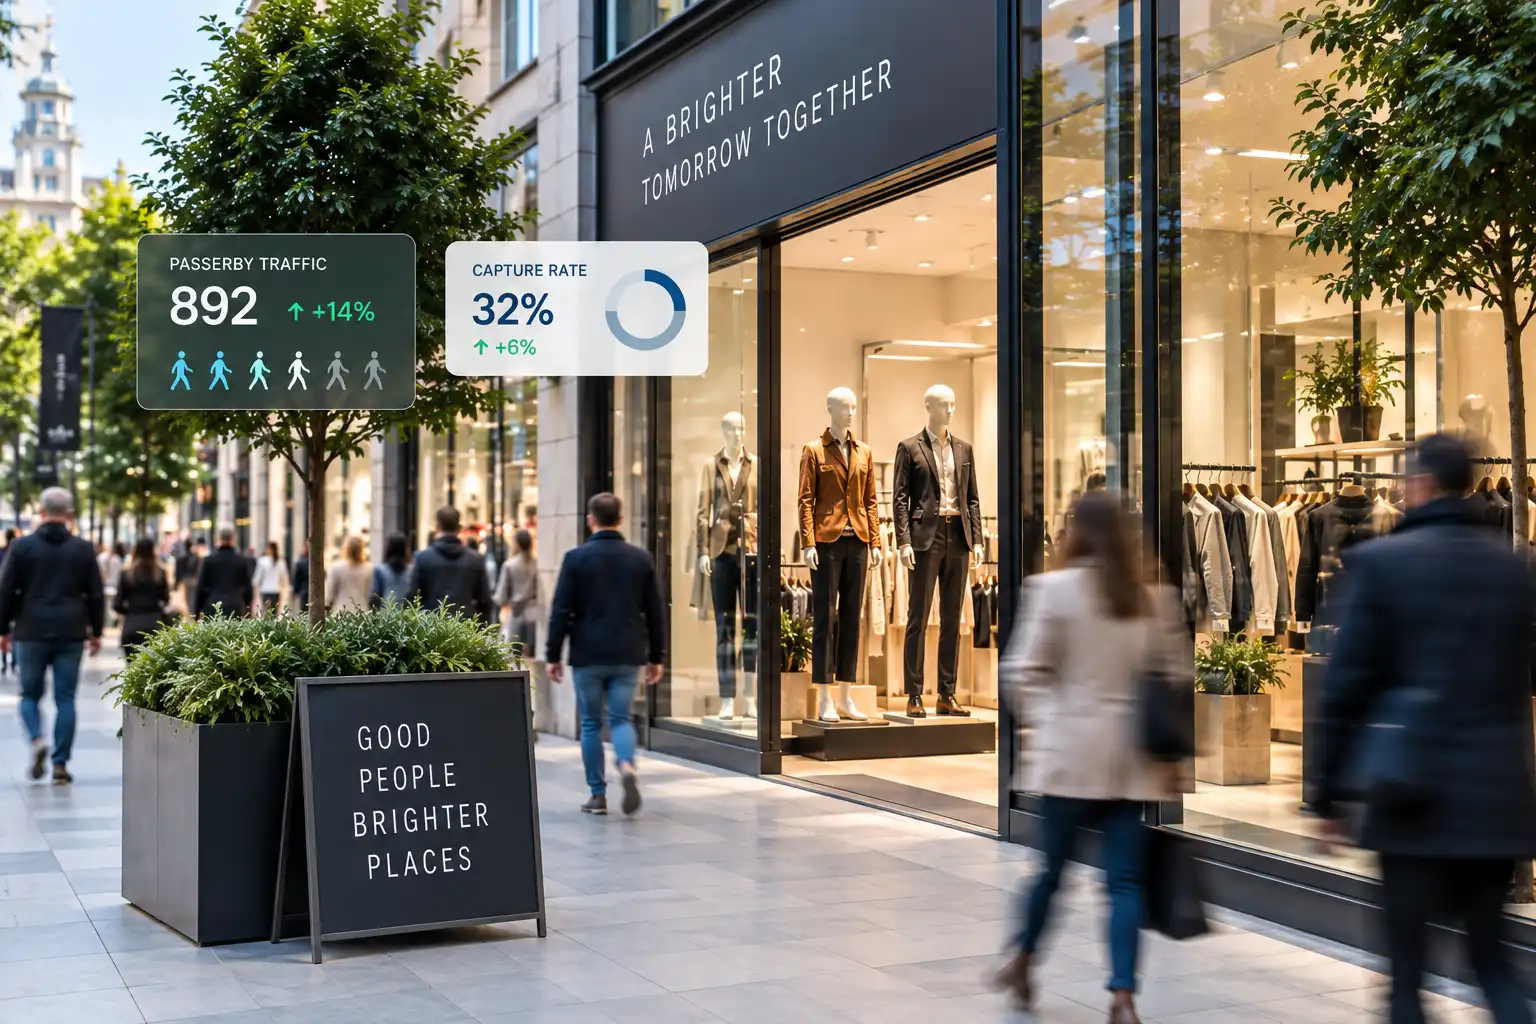
Add context such as passerby traffic, Capture Rate, dwell time and commercial data where relevant and available.

CAPTURE RATE CONTEXT
EXPLORE VISITOR INTELLIGENCE

One data foundation. More context when you need it.

BUILT FOR RETAIL TEAMS

One data foundation. Different retail decisions.

The same visitor data can support different decisions across operations, marketing, store and regional management, and leadership.

SHARED DATA FOUNDATION

Same data. Different questions.

CONSISTENT
VISITOR TREND
+4.8%
PEAK PERIOD
14:00–17:00 Highest traffic
LOCATIONS
31 Same definitions
DIFFERENCES
6 Locations developing differently
RETAIL OPERATIONS

Plan around when customers actually arrive.

Use actual visitor patterns to support staffing, opening hours and day-to-day operations.

01 When do stores need the most resources?
02 How does traffic vary through the week?
03 When do the largest traffic peaks occur?
Industries - Retail  - Section 5 - operations image

Different roles. One consistent view of visitor data.

START WITH WHAT YOU NEED TO UNDERSTAND

What do you need to understand about your stores?

Tell us what you measure today, how many locations you have and which questions you want better answers to. Then we can look at how CountMatters could fit.

01
Understand store traffic

See how visit volumes, peaks and patterns change over time.

02
Compare stores

See which locations are developing differently from the rest of the portfolio.

03
Add more context

Combine visitor data with relevant signals to see what is worth investigating further.

TALK TO US

Let’s look at your stores.

Tell us briefly about your current setup and what you want to understand. We’ll get in touch for a practical conversation about your requirements.

A short conversation. No obligation.

TALK TO US ABOUT RELIABLE RETAIL MEASUREMENT

Learn how CountMatters supports consistent measurement across locations and over time.